
Crude Oil Price Forecast for Today, Tomorrow, Next Week, and 30-Day Forecast

Clear oil prices forecast with key levels, market drivers and outlook for today, the week ahead and the next 30 days to guide trading decisions.
This WTI oil technical analysis covers the main factors driving oil prices: OPEC+ decisions, US inventory data, geopolitical risks, and global demand. See why Crude oil remains a highly liquid instrument for trading in the market, and follow the latest oil price forecast for crude oil.
Key Takeaways
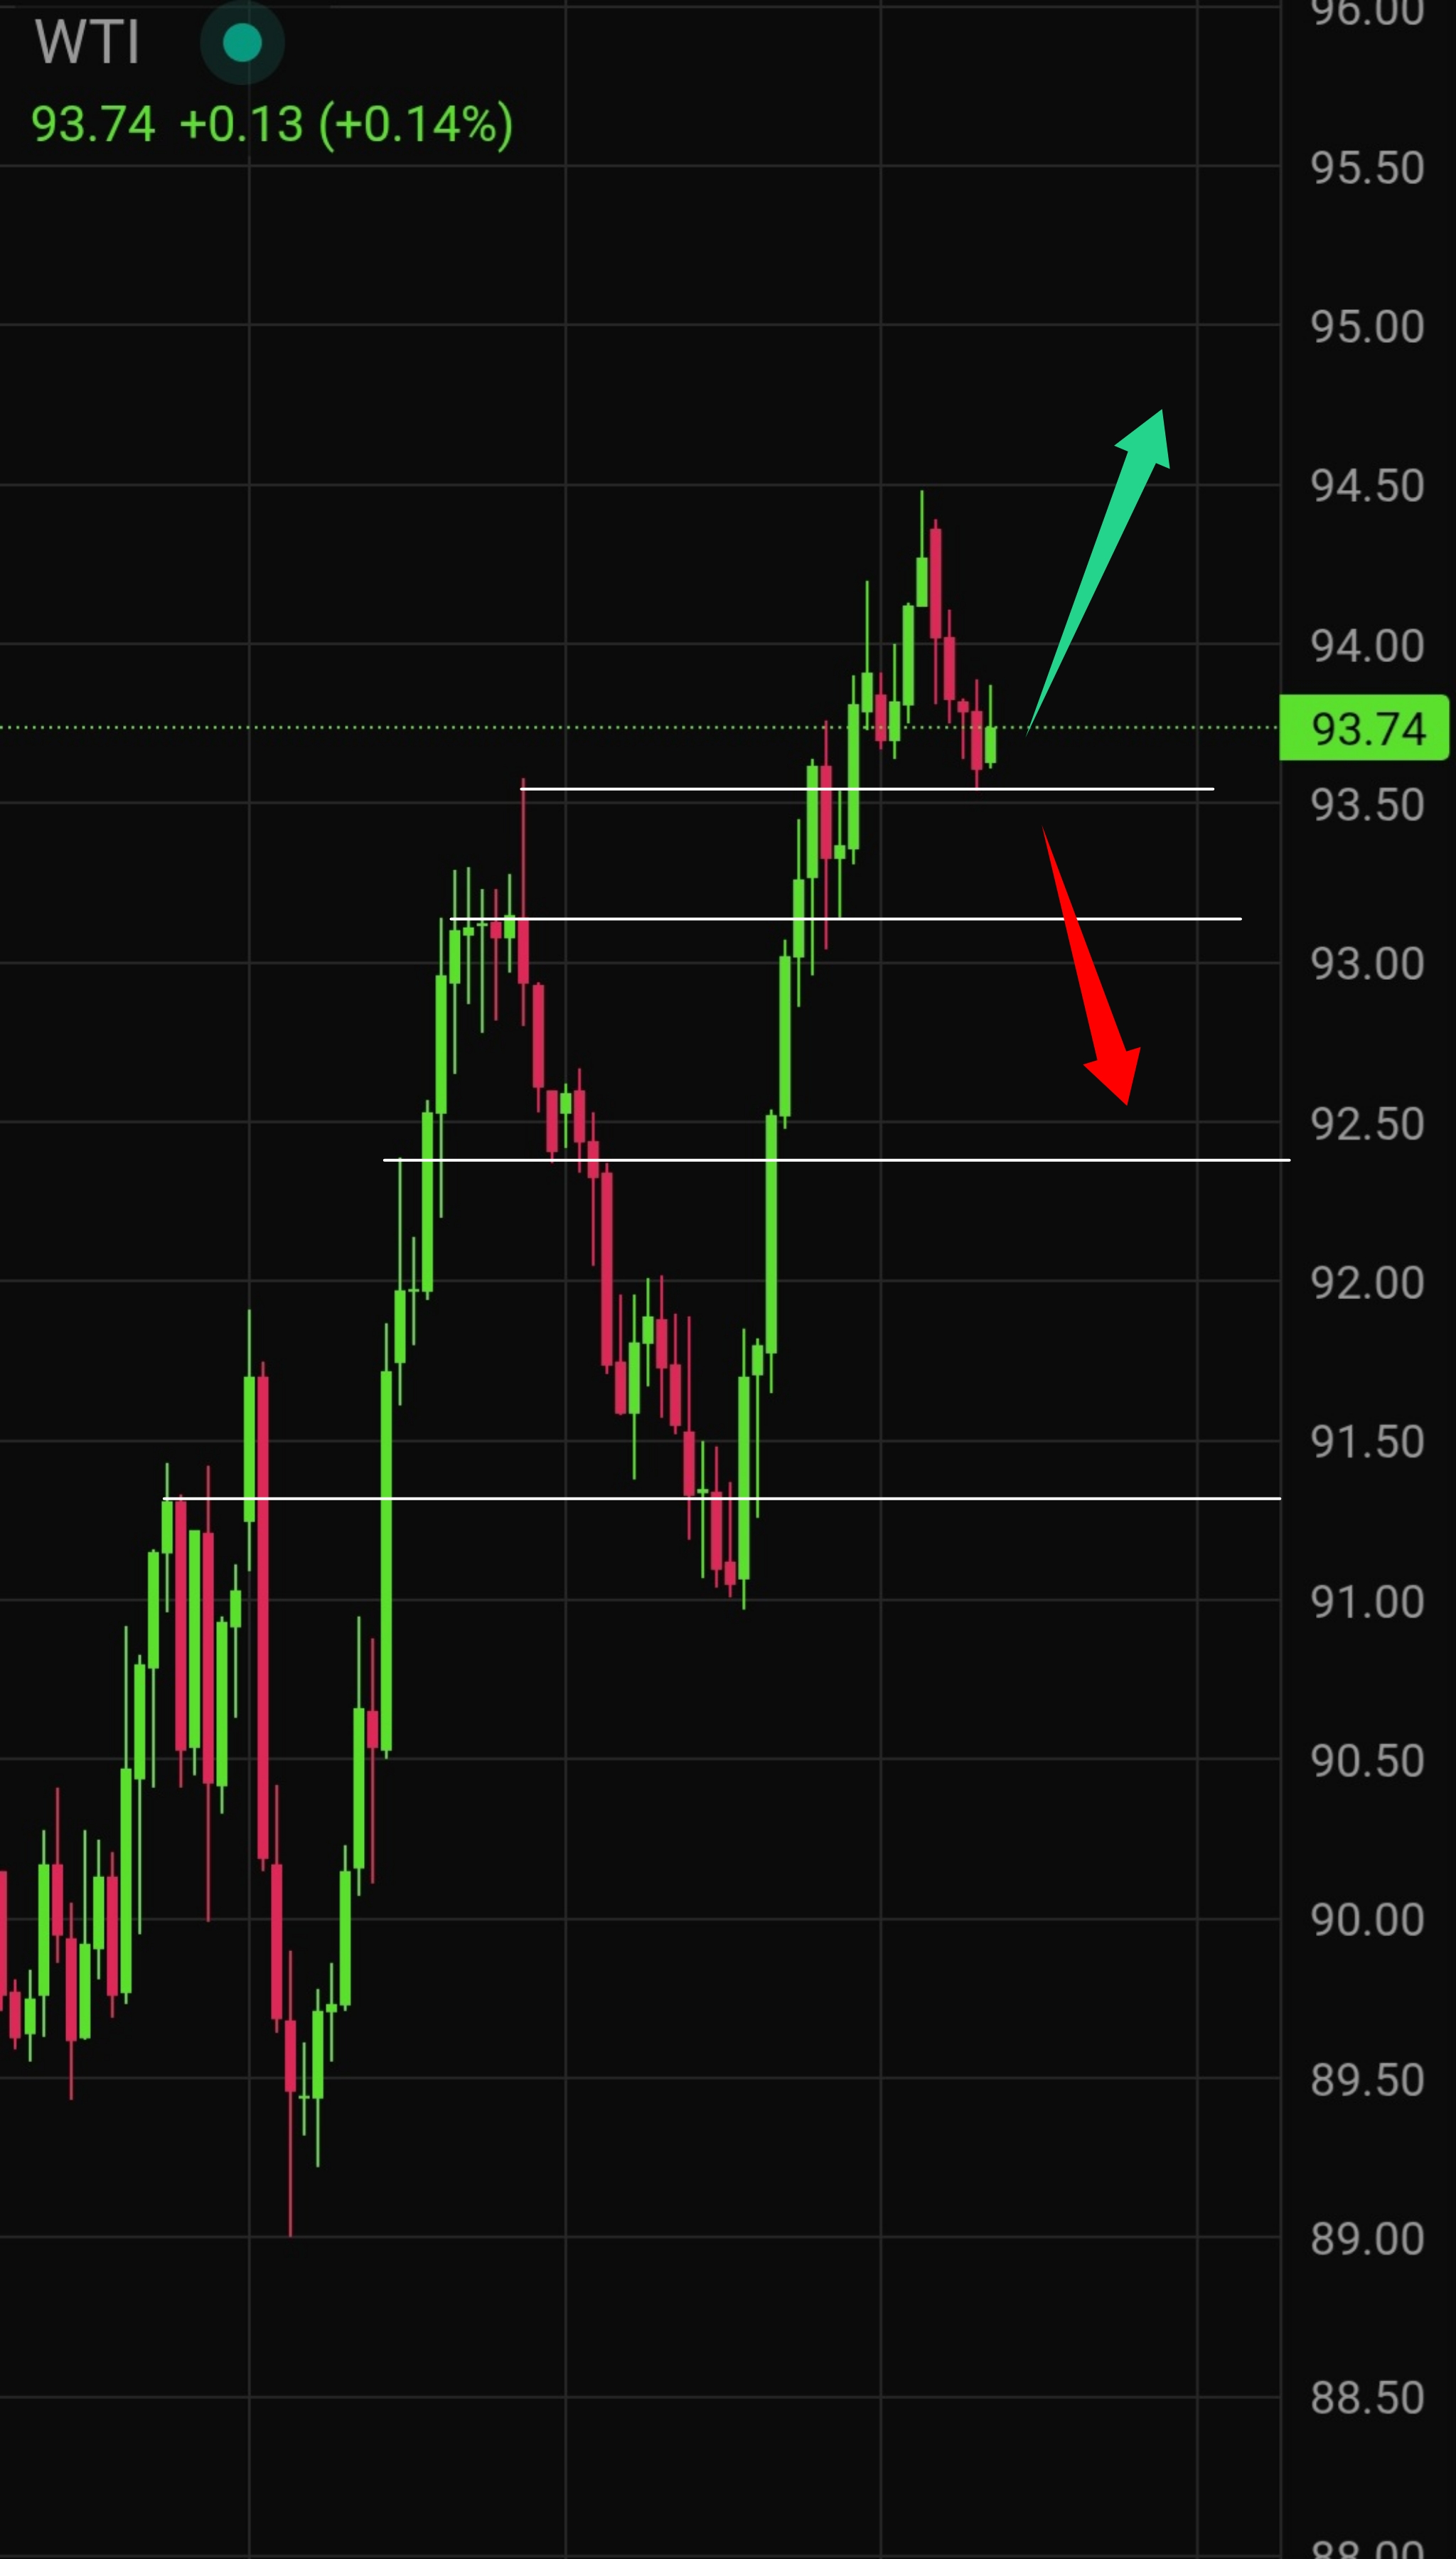
Intraday buying opportunities are favored on holds above $93.50 support, with stops below recent lows; selling becomes relevant on sustained breaks under $93.50 targeting $91.00.
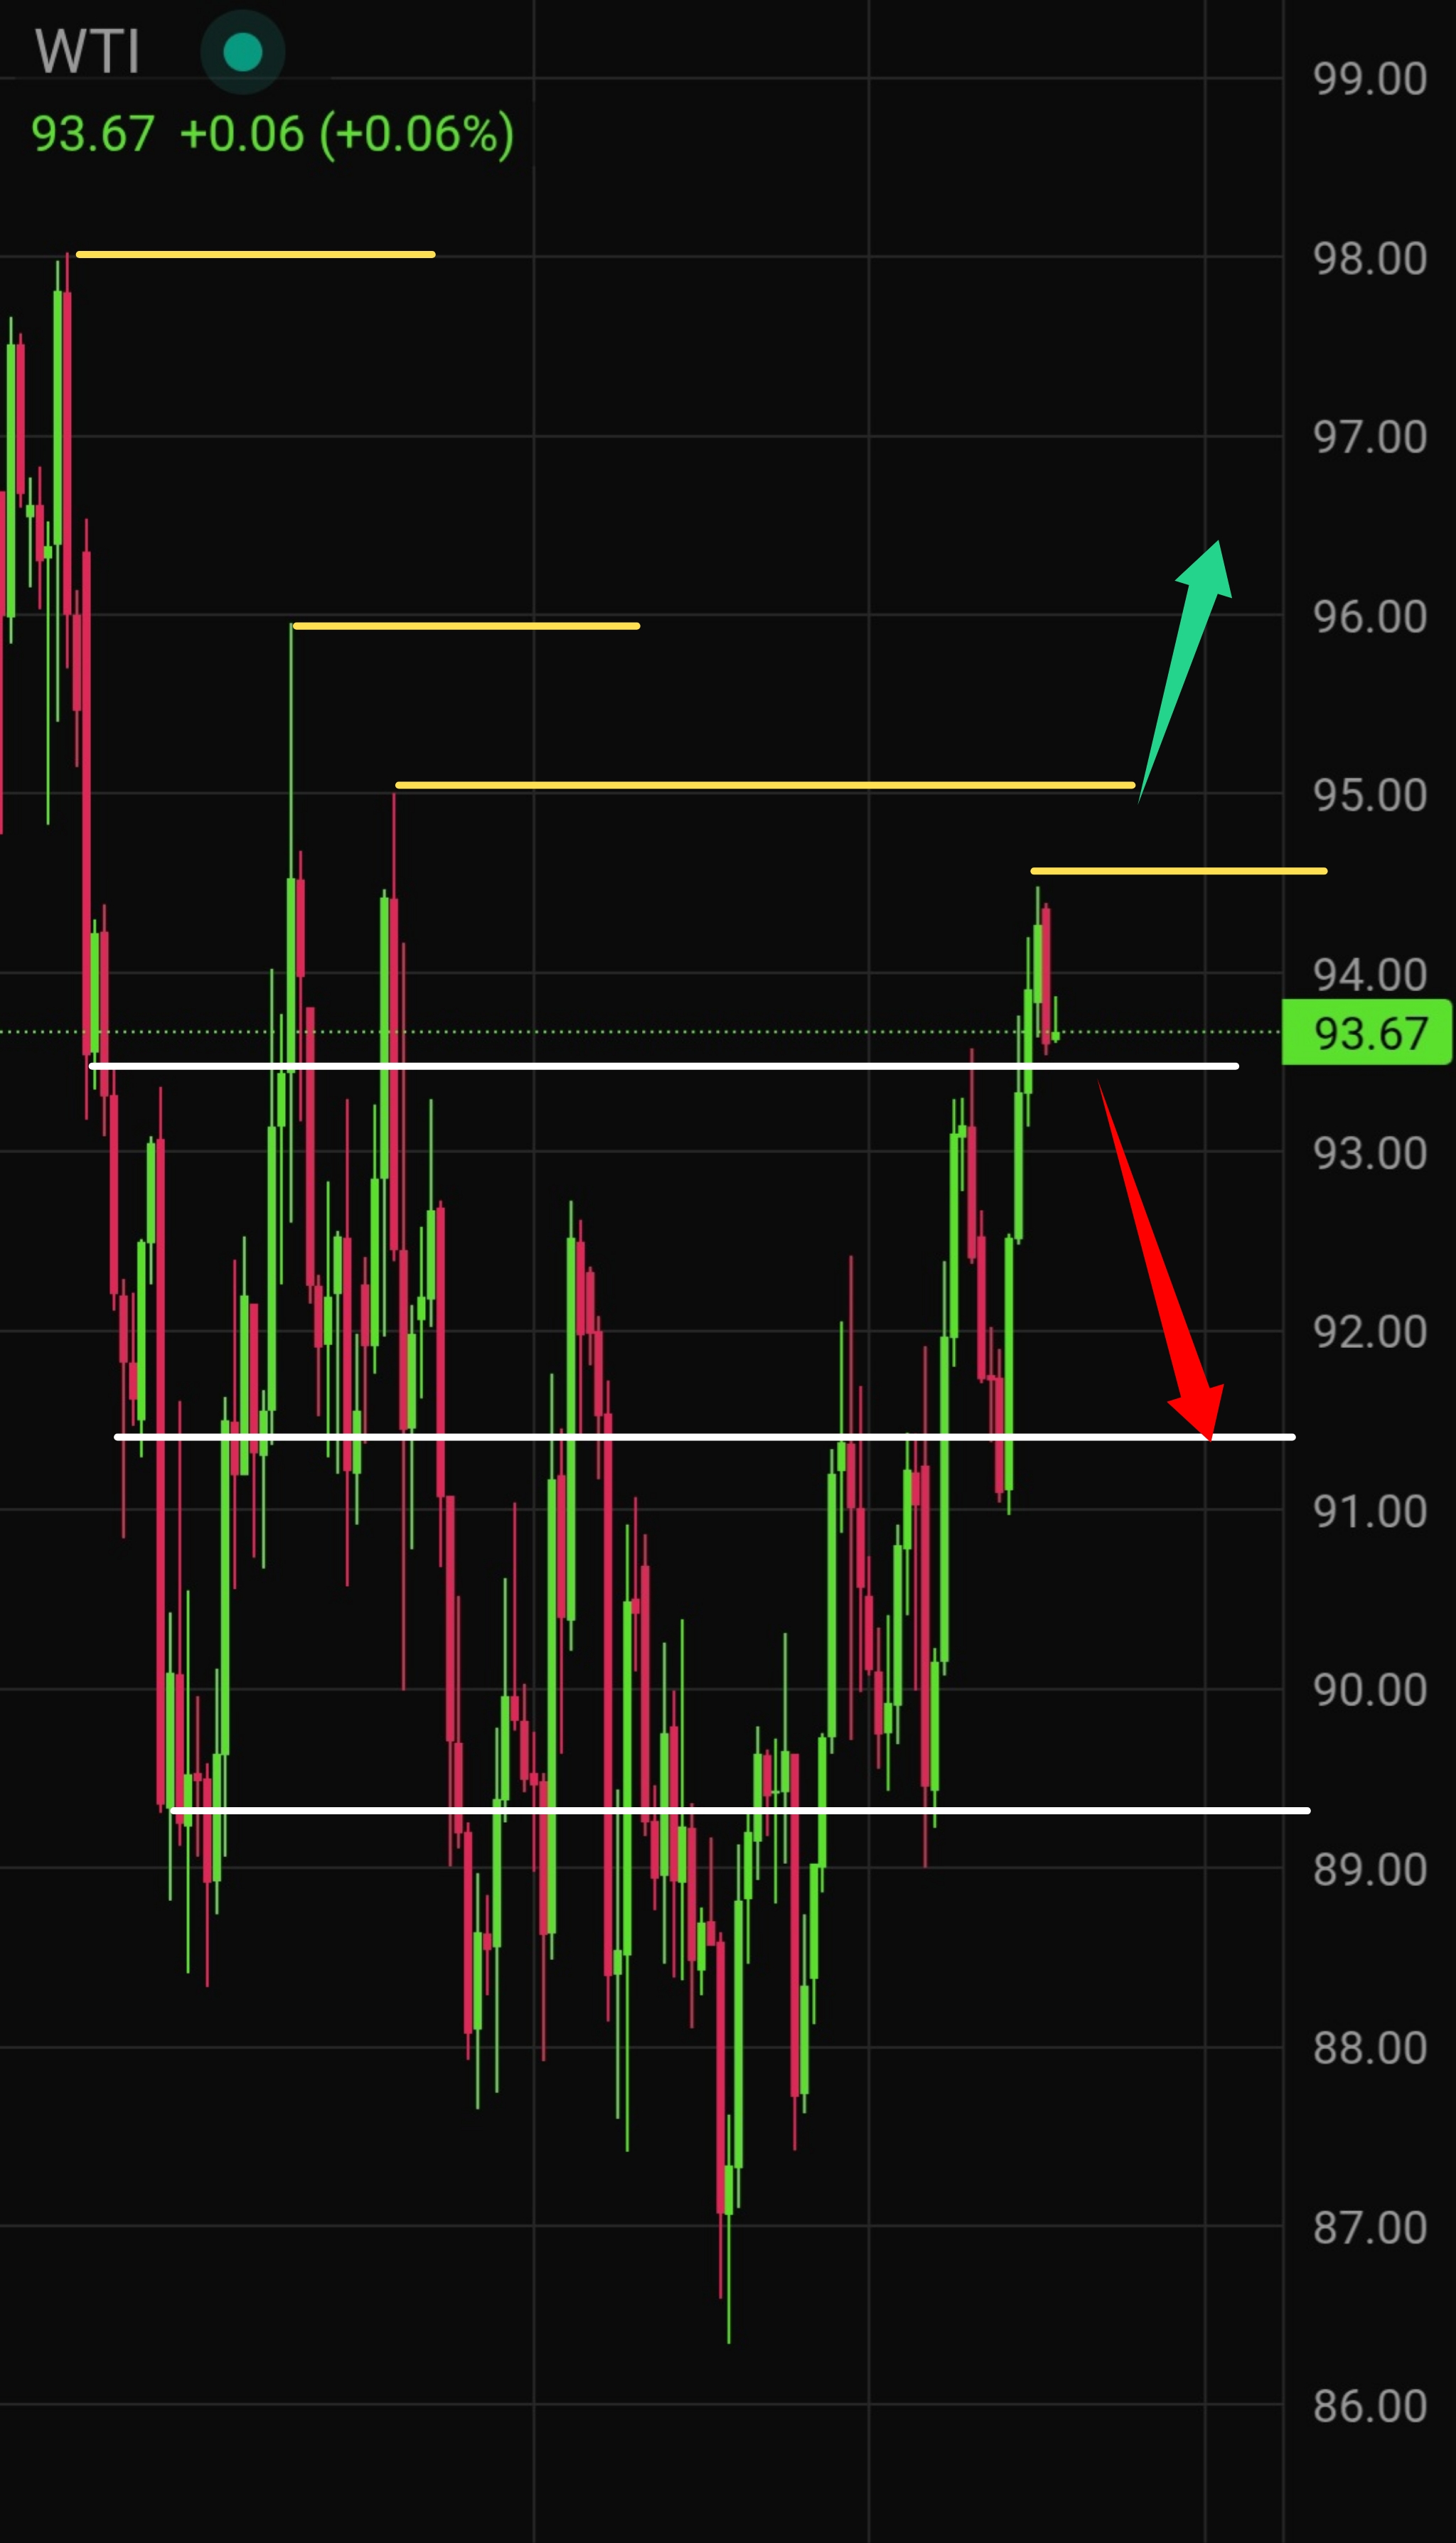
On the weekly timeframe the structure remains cautiously constructive while price holds above $91.00, with upside targets at $95.00–95.50.
Over the next 30 days the base case points to elevated prices supported by limited OPEC+ supply growth and ongoing Middle East risks, though normalization of regional exports could cap gains.
Latest WTI Crude Oil Technical Analysis for Today
H1: WTI oil updated a local high near $94.50 before pulling back in a technical correction toward $93.50. As long as buyers defend this support zone, the path of least resistance remains higher toward $95.00–95.50.
RSI: 58,02
MACD: Bearish
MA: $93,84
H4: Despite the recent bullish impulse, the broader structure still shows lower highs, keeping the medium-term bias under pressure. A clean break and hold above $95.00 would be required to confirm a fuller upside reversal. Failure to clear that level leaves the door open for a renewed decline toward $91.00.
RSI: 60,52
MACD: Bullish
MA: $92,i7
Oil Trading Plan for Today
- Supports: $93.50, $91.00
- Resistances: $95.00, $95.50
- Base scenario: Break and hold above $95.00 opens the way for further gains.
- Alternative scenario: Loss of $93.50 support risks a slide toward $91.00.
Oil Live Price Today
WTI traded lower after OPEC reported a roughly 900,000 bpd rise in OPEC+ output to 39.07 million bpd in September and cut its 2026 demand growth forecast.
Softer demand expectations combined with higher supply weighed on the complex, while lingering Middle East supply-risk headlines limited the downside.
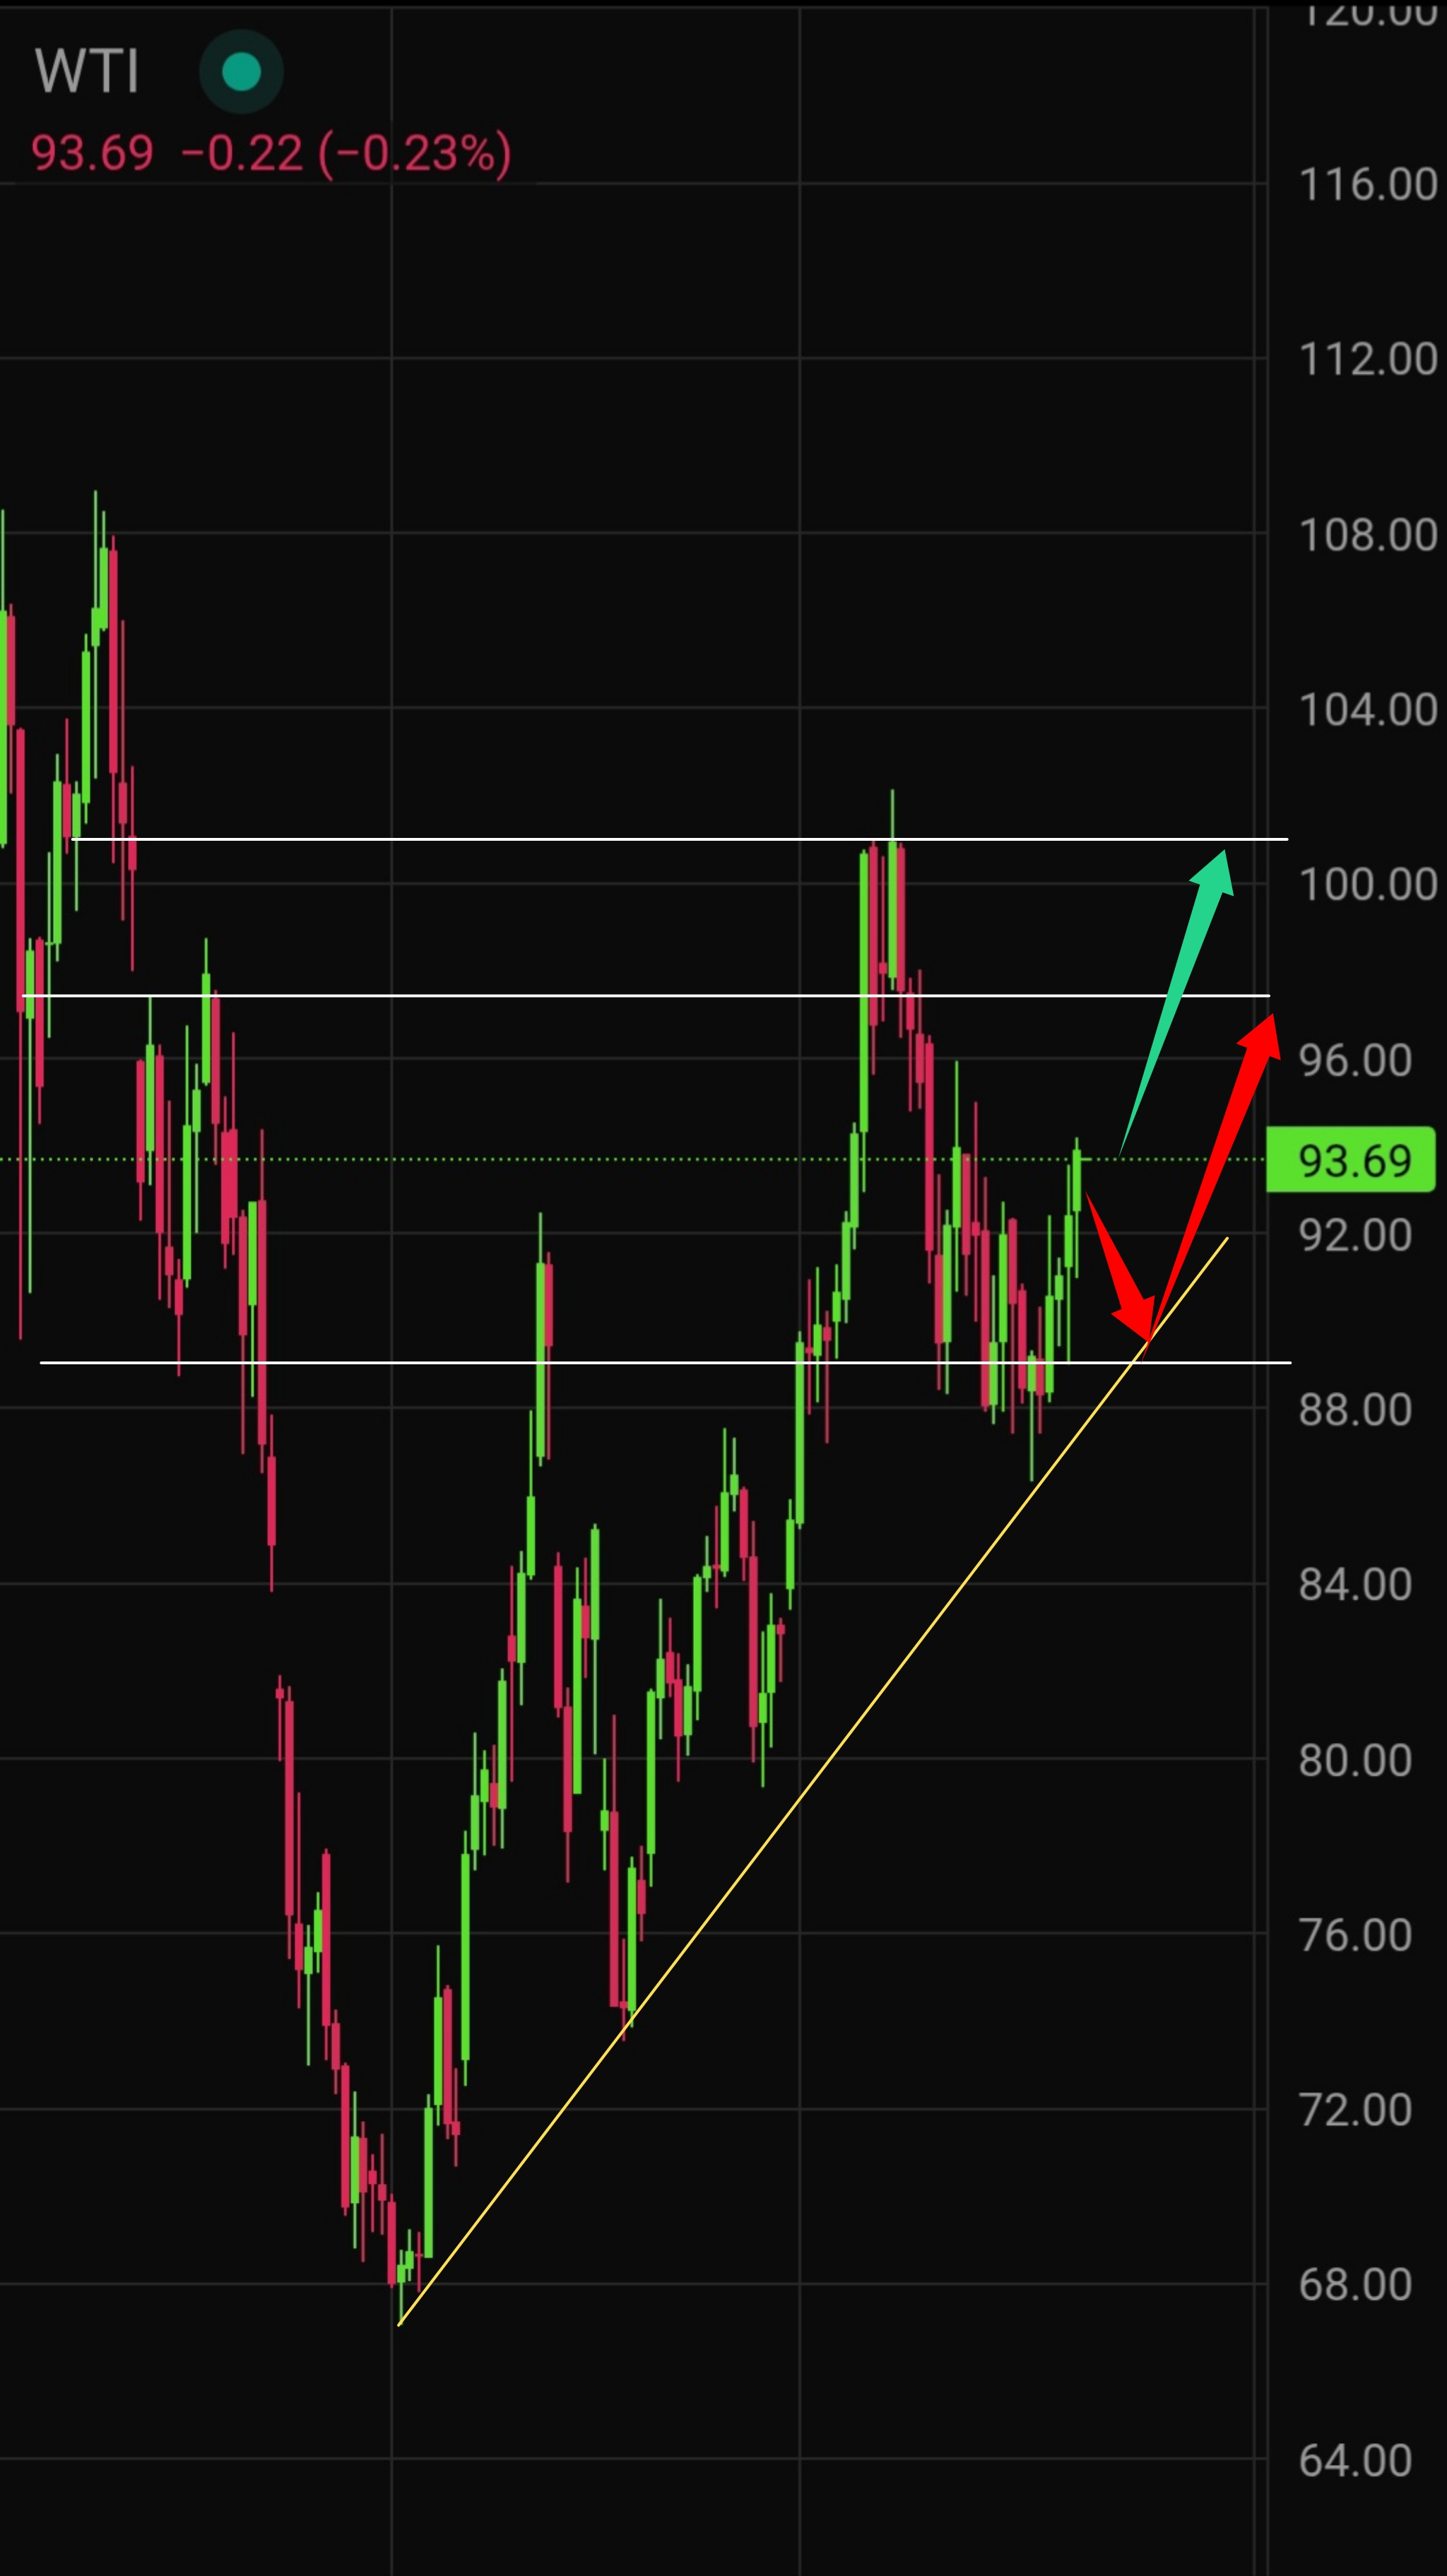
On the daily chart the broader uptrend remains intact; a corrective move toward $91.00 would not yet invalidate the bullish bias.

Oil Price Forecast for Tomorrow
Tomorrow’s U.S. retail sales and producer-price data can influence dollar direction and growth expectations, while the delayed EIA crude inventory report (due 15 October) remains the key near-term supply signal. Inventory draws typically support prices; builds tend to pressure them, though the size of any surprise and product-stock dynamics matter most.
Will oil go up tomorrow? Upside remains the preferred scenario, although a dense cluster of resistance near $95.00 raises the risk of profit-taking.
Oil Price Forecast for This Week
Key events this week include the potential OPEC Monthly Oil Market Report on 15 October and ongoing monitoring of Middle East supply disruptions and any strategic-reserve releases.
Inventory draws and logistical interruptions continue to underpin prices, while rising stocks or improved export flows would weigh on the complex.
Geopolitics can easily override the data.
| Date |
October 12 – October 16, 2026 |
| Minimum | $88,98 |
| Average | $91,73 |
| Maximum |
$94,48 |
Oil Price Forecast for the Next 30 Days
OPEC+ has confirmed no change to November output targets; the next ministerial meeting is scheduled for 1 November.
Geopolitical tensions continue to broaden, with reports of Pakistan and Turkey agreeing under the Mecca framework to supply forces and rapid-deployment assets to Saudi Arabia.
Middle East crude exports have recovered from early-year lows, yet tanker attacks have increased.
Notable scheduled events:
- 13–14 October: IEA Oil Market Report and related global balances
- Weekly: EIA U.S. inventory data
- 14–15 October: U.S. CPI/PPI and retail sales
- 28 October: Federal Reserve rate decision
- 29 October: U.S. Q3 GDP (advance)
- 1 November: OPEC+ meeting
The 30-day WTI price outlook next month continues to lean higher on limited supply, low inventories, and the absence of additional OPEC+ barrels. The main risks remain a faster-than-expected recovery of Hormuz flows and any clear signs of softening demand. WTI day-to-day forecasts will stay sensitive to inventory prints, while the broader WTI price target hinges on the pace of Middle East supply normalization and the 1 November OPEC+ decision.
Oil Price Analysis and Forecasting Methodology
Our oil forecast methodology combines fundamental analysis of supply-demand balances, OPEC decisions, inventories and geopolitical risks with technical analysis of price charts, trends and key levels. We also factor in market sentiment from positioning data and news flow. This multi-layered approach to calculating oil price forecasts delivers balanced, data-driven projections you can rely on.
Is Oil a Good Investment?
Is oil a good investment? With ongoing energy demand, limited supply flexibility and geopolitical premiums, oil remains a strong portfolio diversifier in 2026. Should I invest in oil? Many investors use it to hedge inflation and capture potential upside. Start your oil investment 2026 journey today — open an account and begin trading in minutes.
Summary
WTI remains supported by limited OPEC+ output growth and Middle East supply uncertainty, with near-term resistance clustered around $95.00–95.50. A corrective dip toward $91.00 would not yet break the broader constructive bias, though inventory trends and the 1 November OPEC+ meeting will be decisive for the next leg.
Crude Oil Price Forecast FAQs
What is the current price of Crude Oil now?
October 15, 2026
$92.82
When Will Oil Prices Drop?
A sustained break below $93.50 support would open the path toward $91.00. Broader downside pressure would require confirmation of rising U.S. inventories, normalized Middle East exports, and weaker demand signals from upcoming economic data.
Will Oil Rise or Fall Next Week?
The preferred scenario remains mildly bullish while price holds above $93.50, targeting $95.00–95.50. However, dense resistance and potential inventory builds or geopolitical de-escalation could keep the market range-bound or trigger a corrective dip.
How Do We Do Oil Technical Analysis?
We combine chart patterns, support/resistance, moving averages, RSI and MACD with fundamental factors like supply data, inventories and geopolitics. This integrated approach strengthens trend signals and improves forecast accuracy in our oil reviews.
How to Trade Oil Technical Analysis?
Follow the ready technical setups and levels provided in our daily oil reviews. We already combine indicators with fundamental context, so you receive clear entry zones, targets and risk parameters without extra work.
Khaled Kamal is a Market Analyst & Business Development Manager at Investizo with several years of experience in the financial services industry. His areas of focus include forex markets, trading strategies, risk management, copy trading and the practical aspects of financial markets.
Award history
More about awards
2023—2025 - 8 awards archived