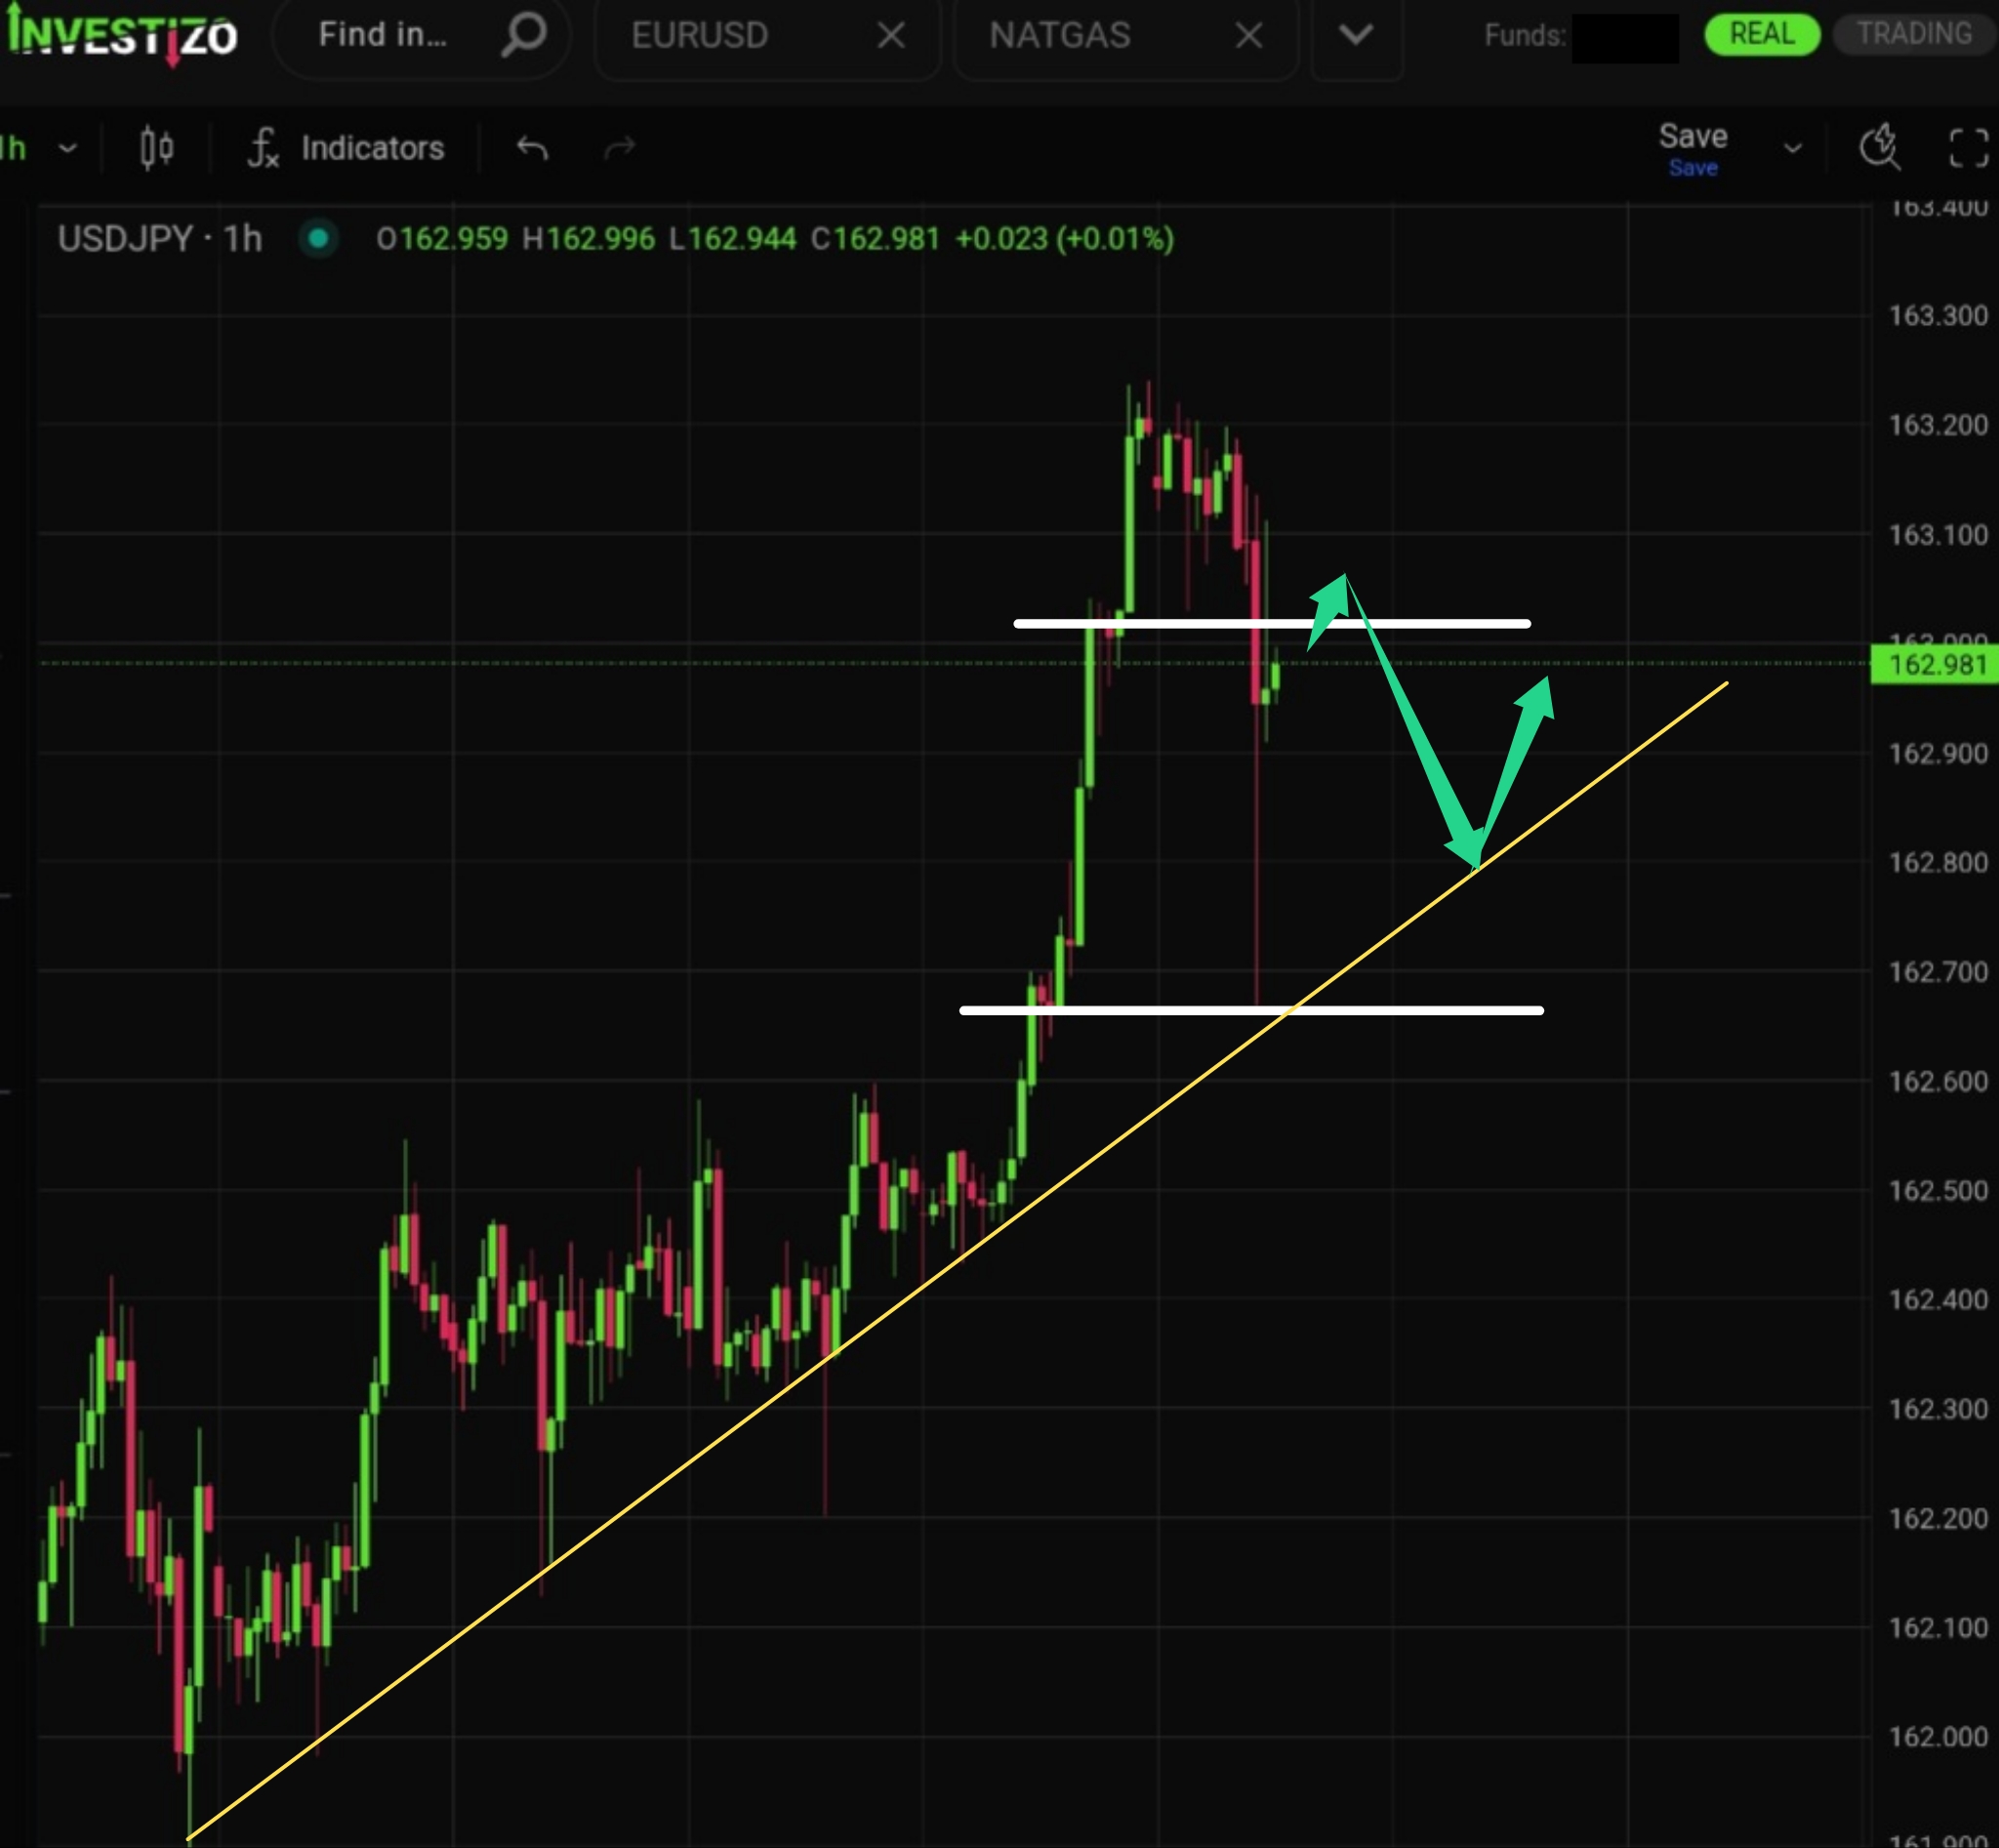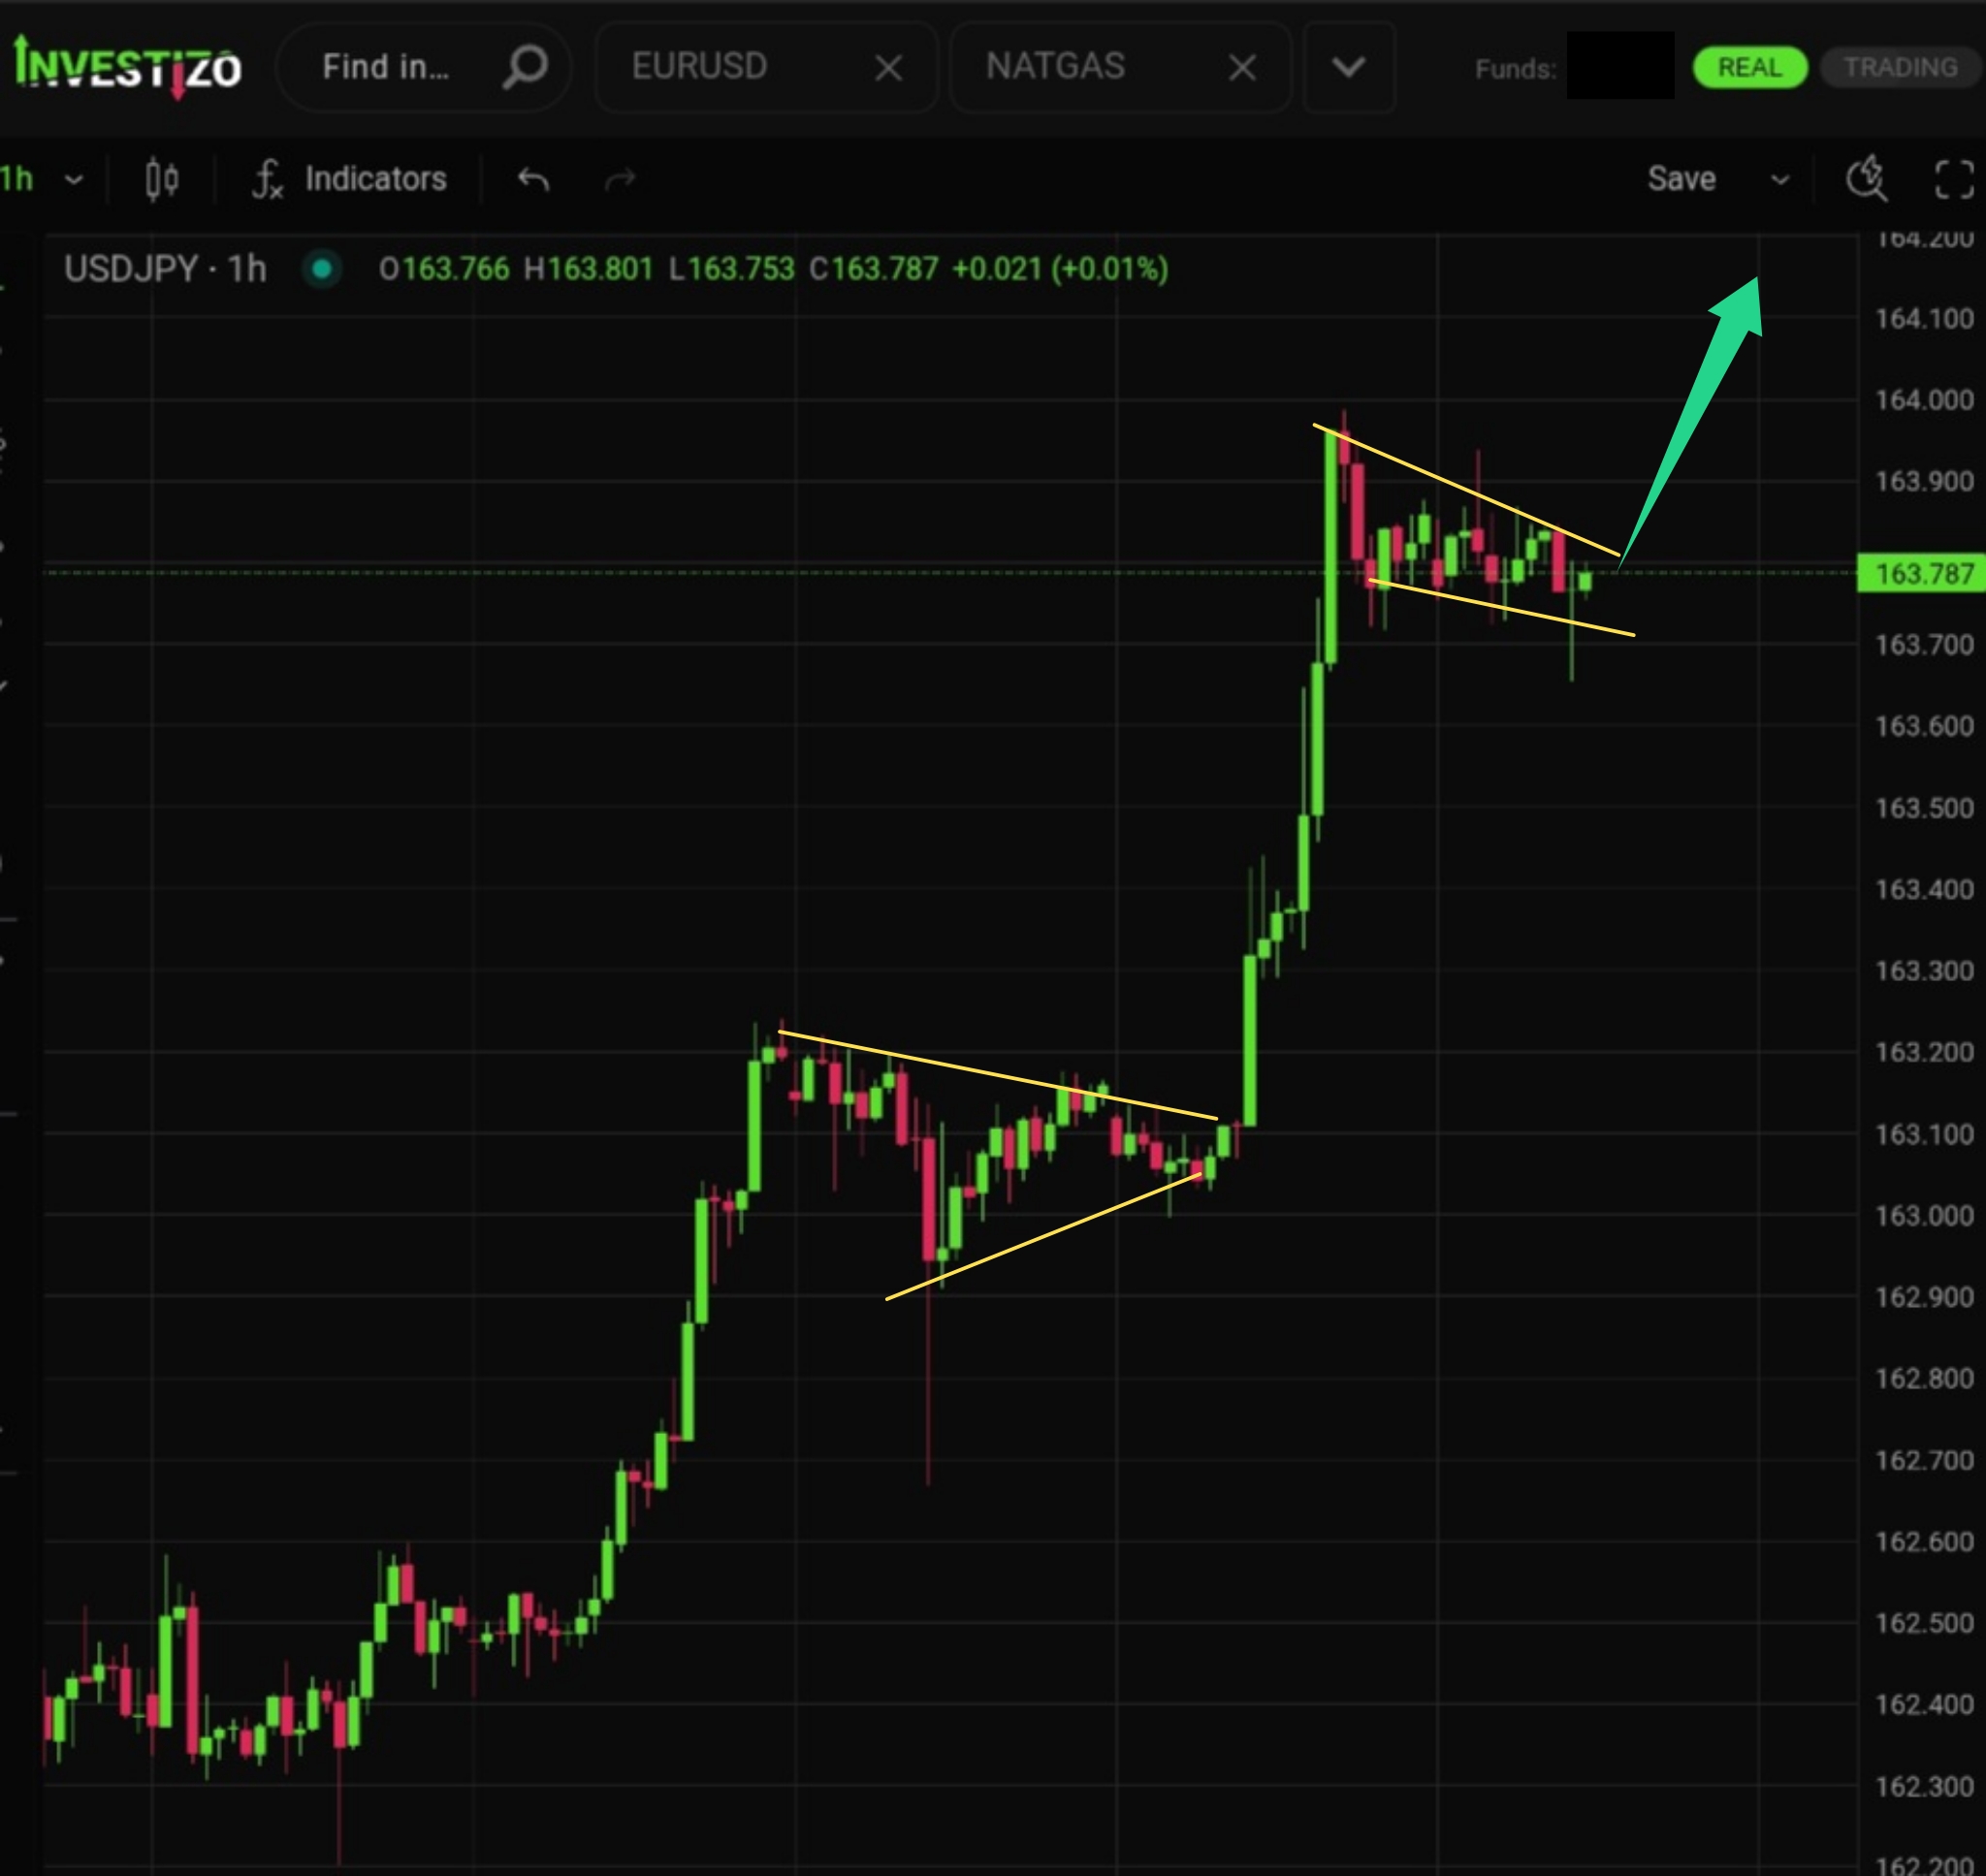
USD/JPY, Technical Analysis – H1
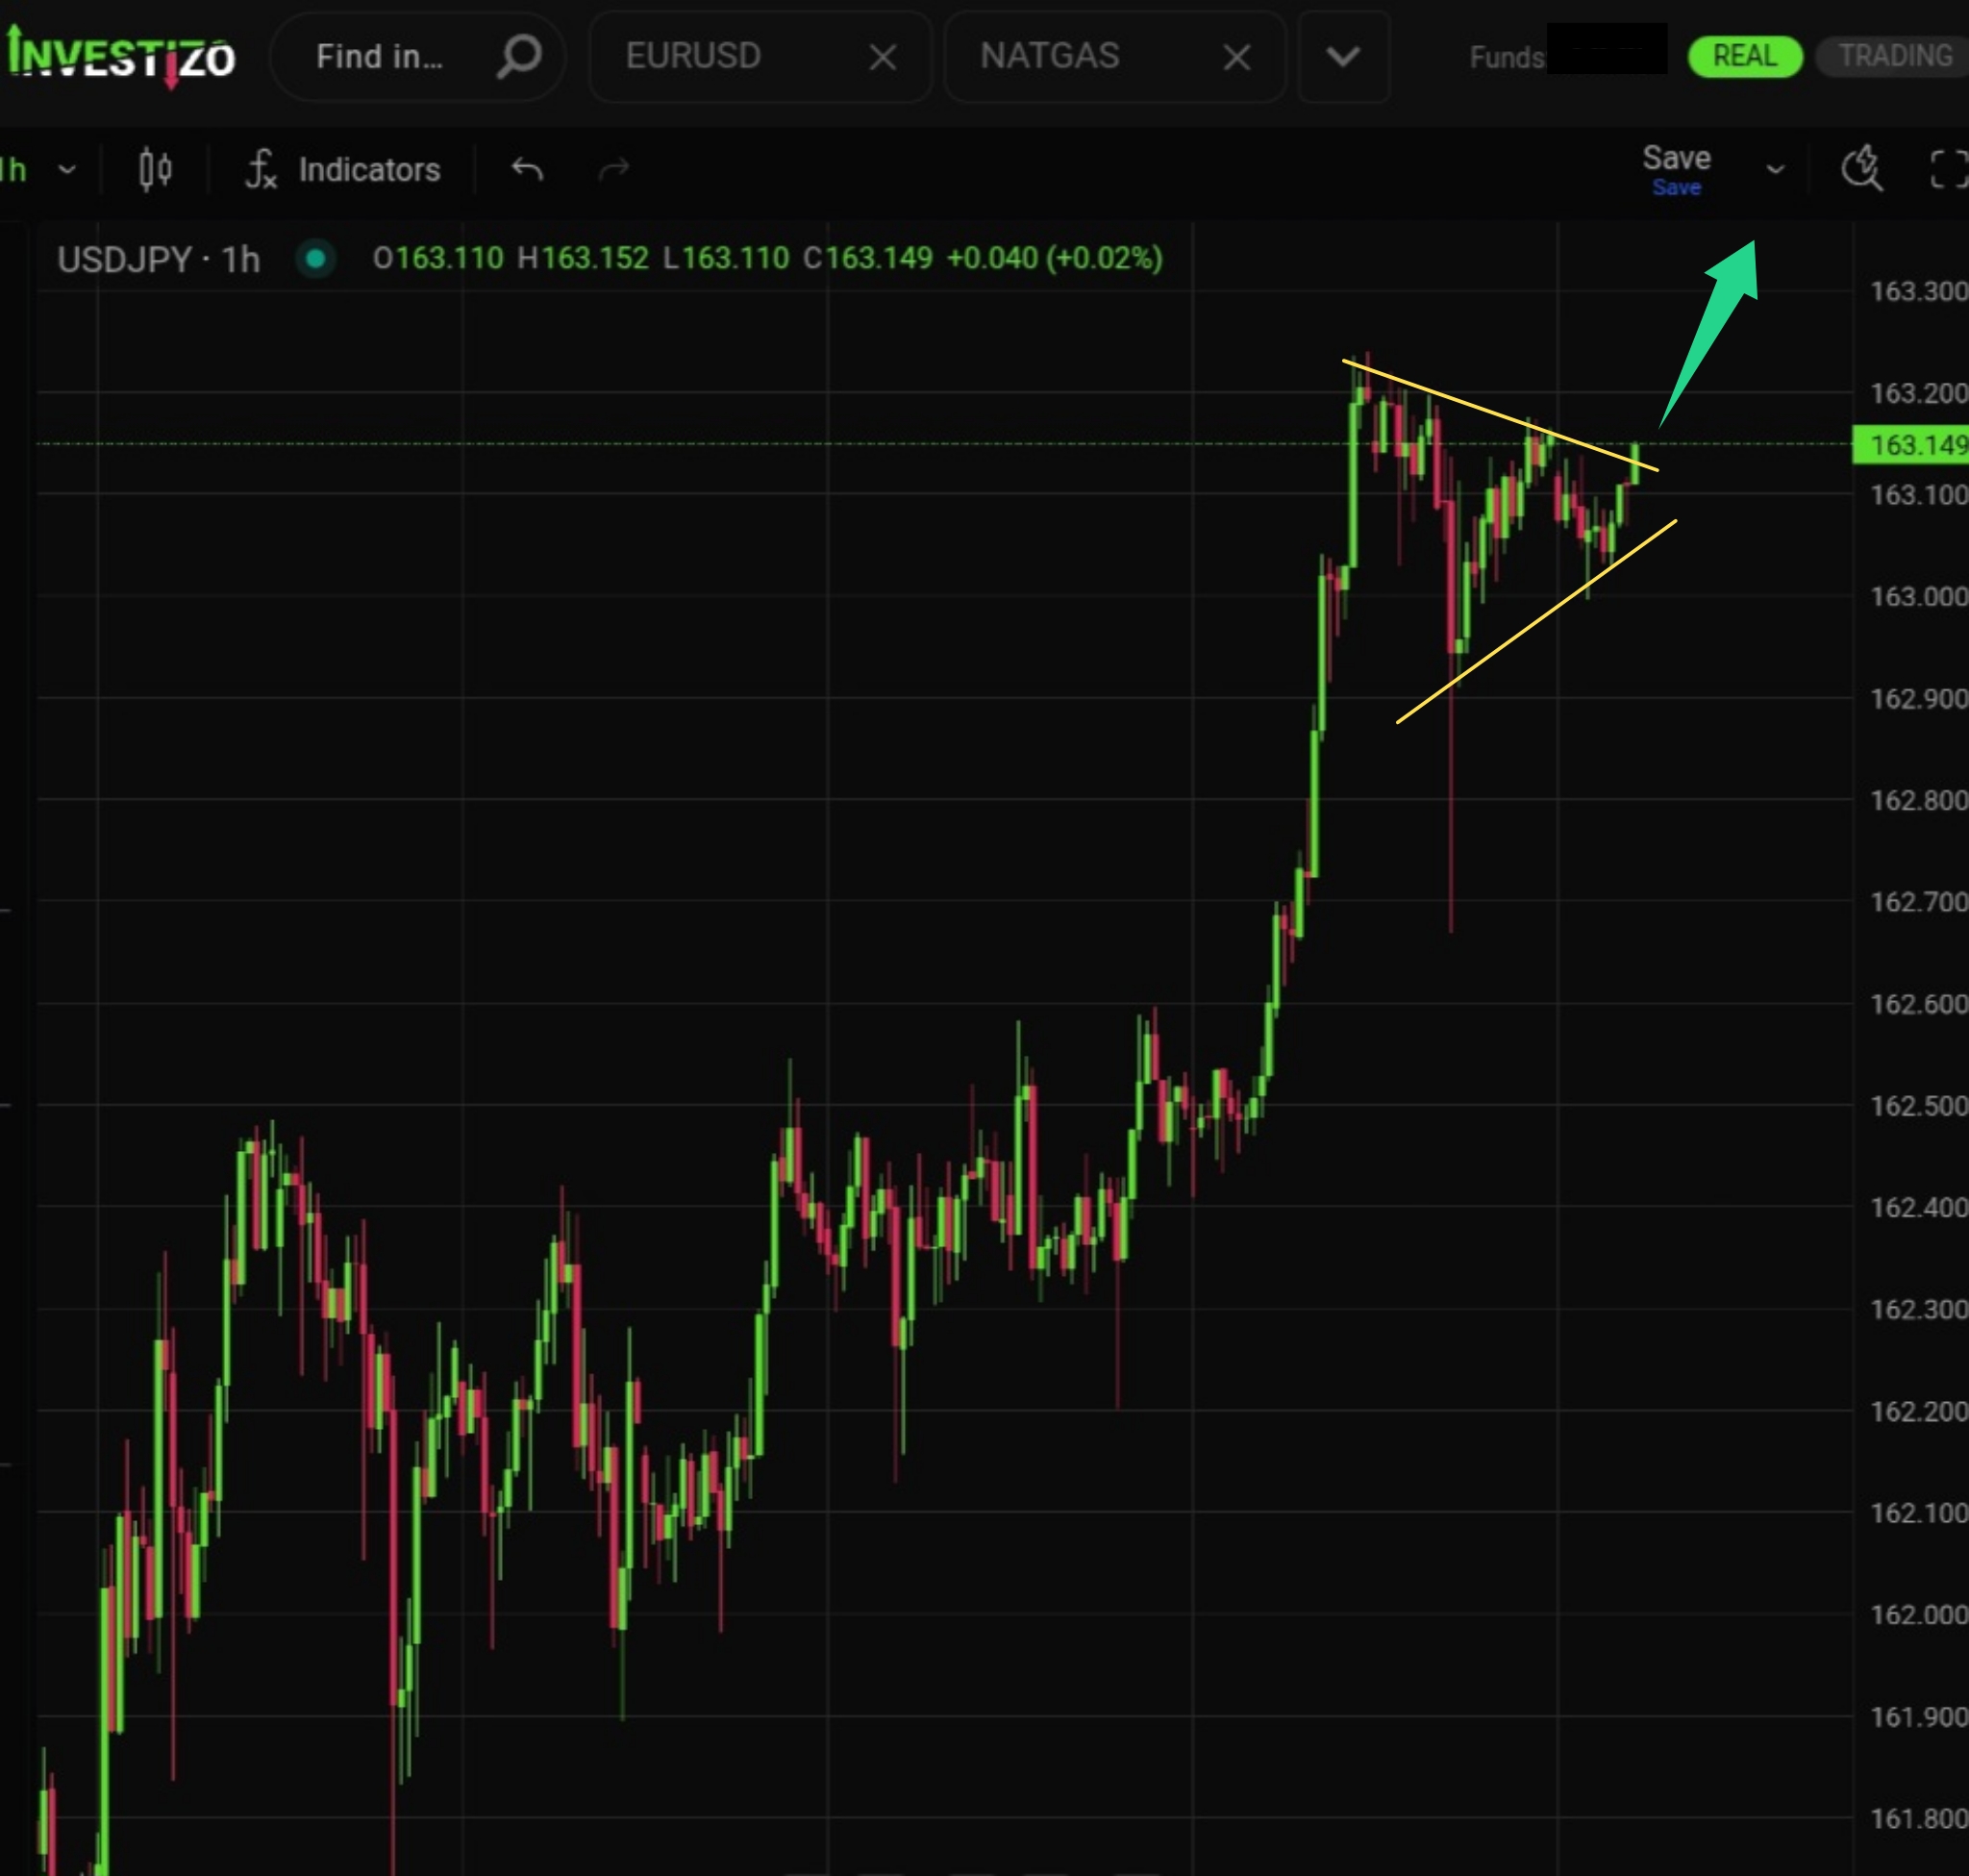
Another bullish continuation pattern is forming — a classic “Bull Flag.”
Investizo LTD. Business company number 25432 BC 2019
Suite 305, Griffith Corporate Centre,
P.O. Box 1510, Beachmont, Kingstown,
St. Vincent and the Grenadines
DUNS 817053497
Phone:+996312610515
E-mail: [email protected]
© 2019-2026 Investizo 18+ کلیه حقوق محفوظ است
هشدار ریسک: CFD محصولات مالی پیچیده ای هستند که با مارجین معامله می شوند. معاملات CFD دارای ریسک است و ممکن است برای همه سرمایه گذاران مناسب نباشد. اطمینان حاصل کنید که خطرات مربوط به آن را درک می کنید زیرا ممکن است سرمایه خود را از دست بدهید.
Another bullish continuation pattern is forming — a classic “Bull Flag.”
The medium-term structure remains bullish for now, with consistently higher local lows and renewed highs.
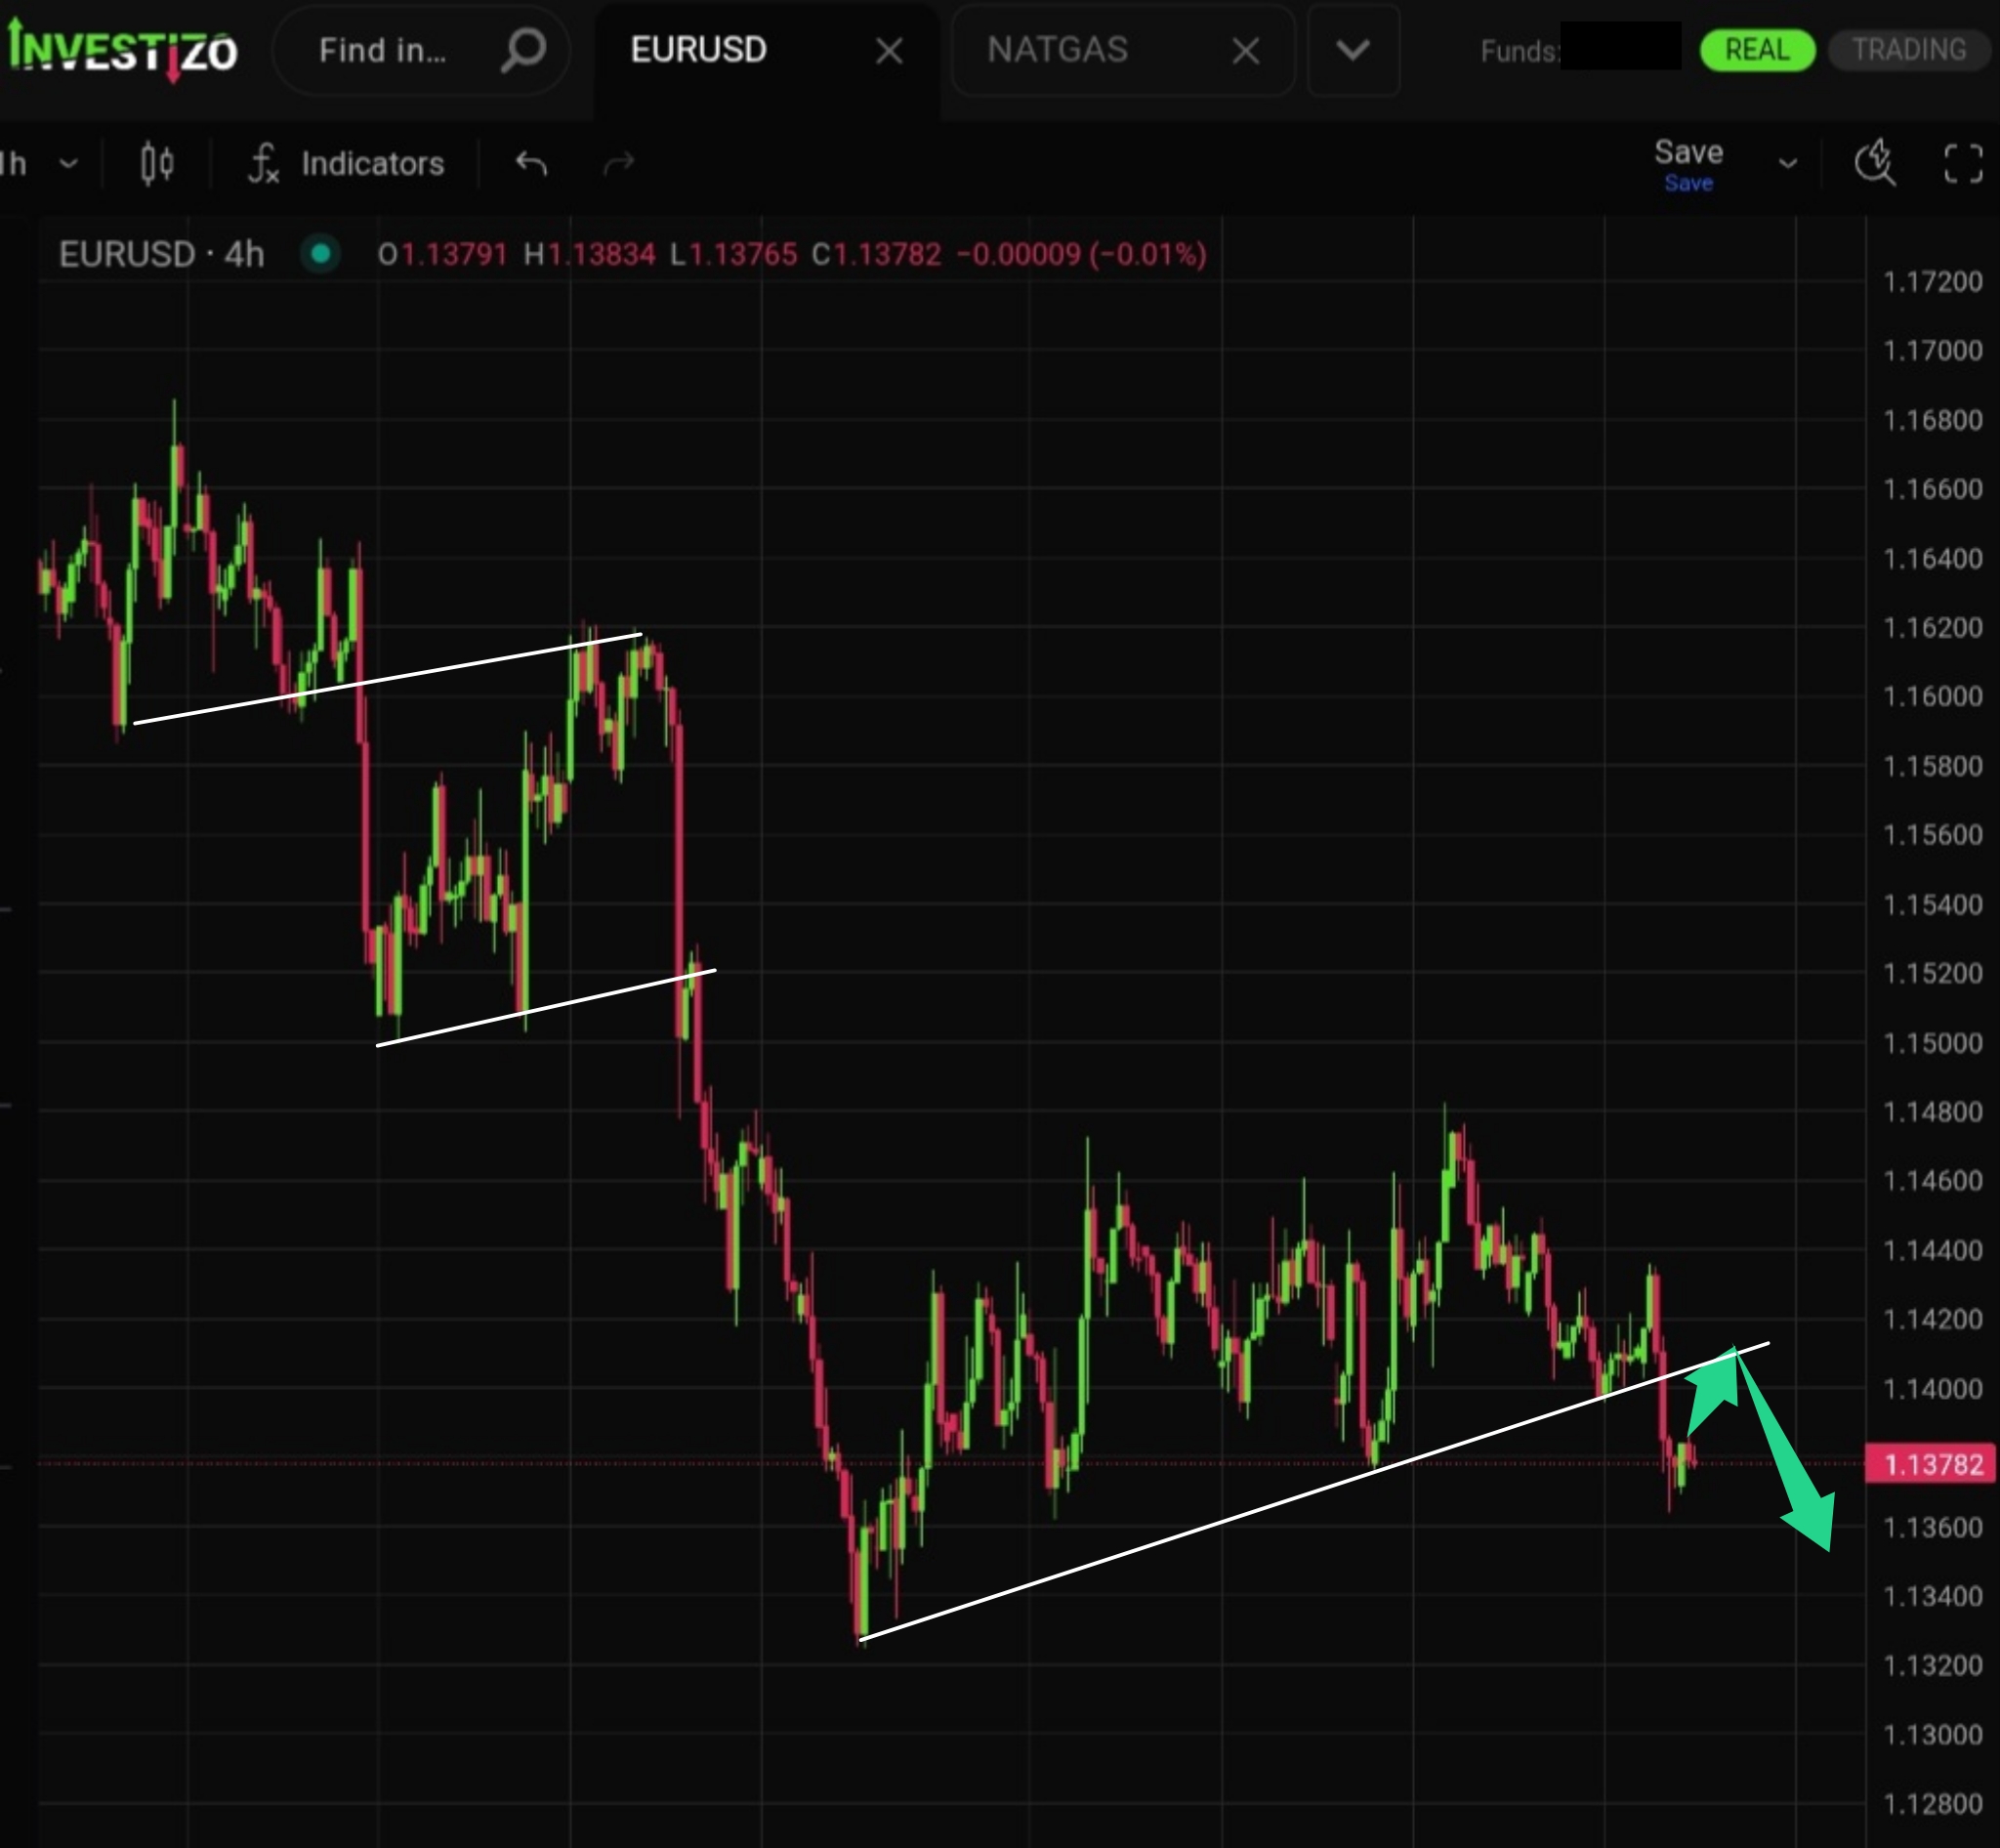
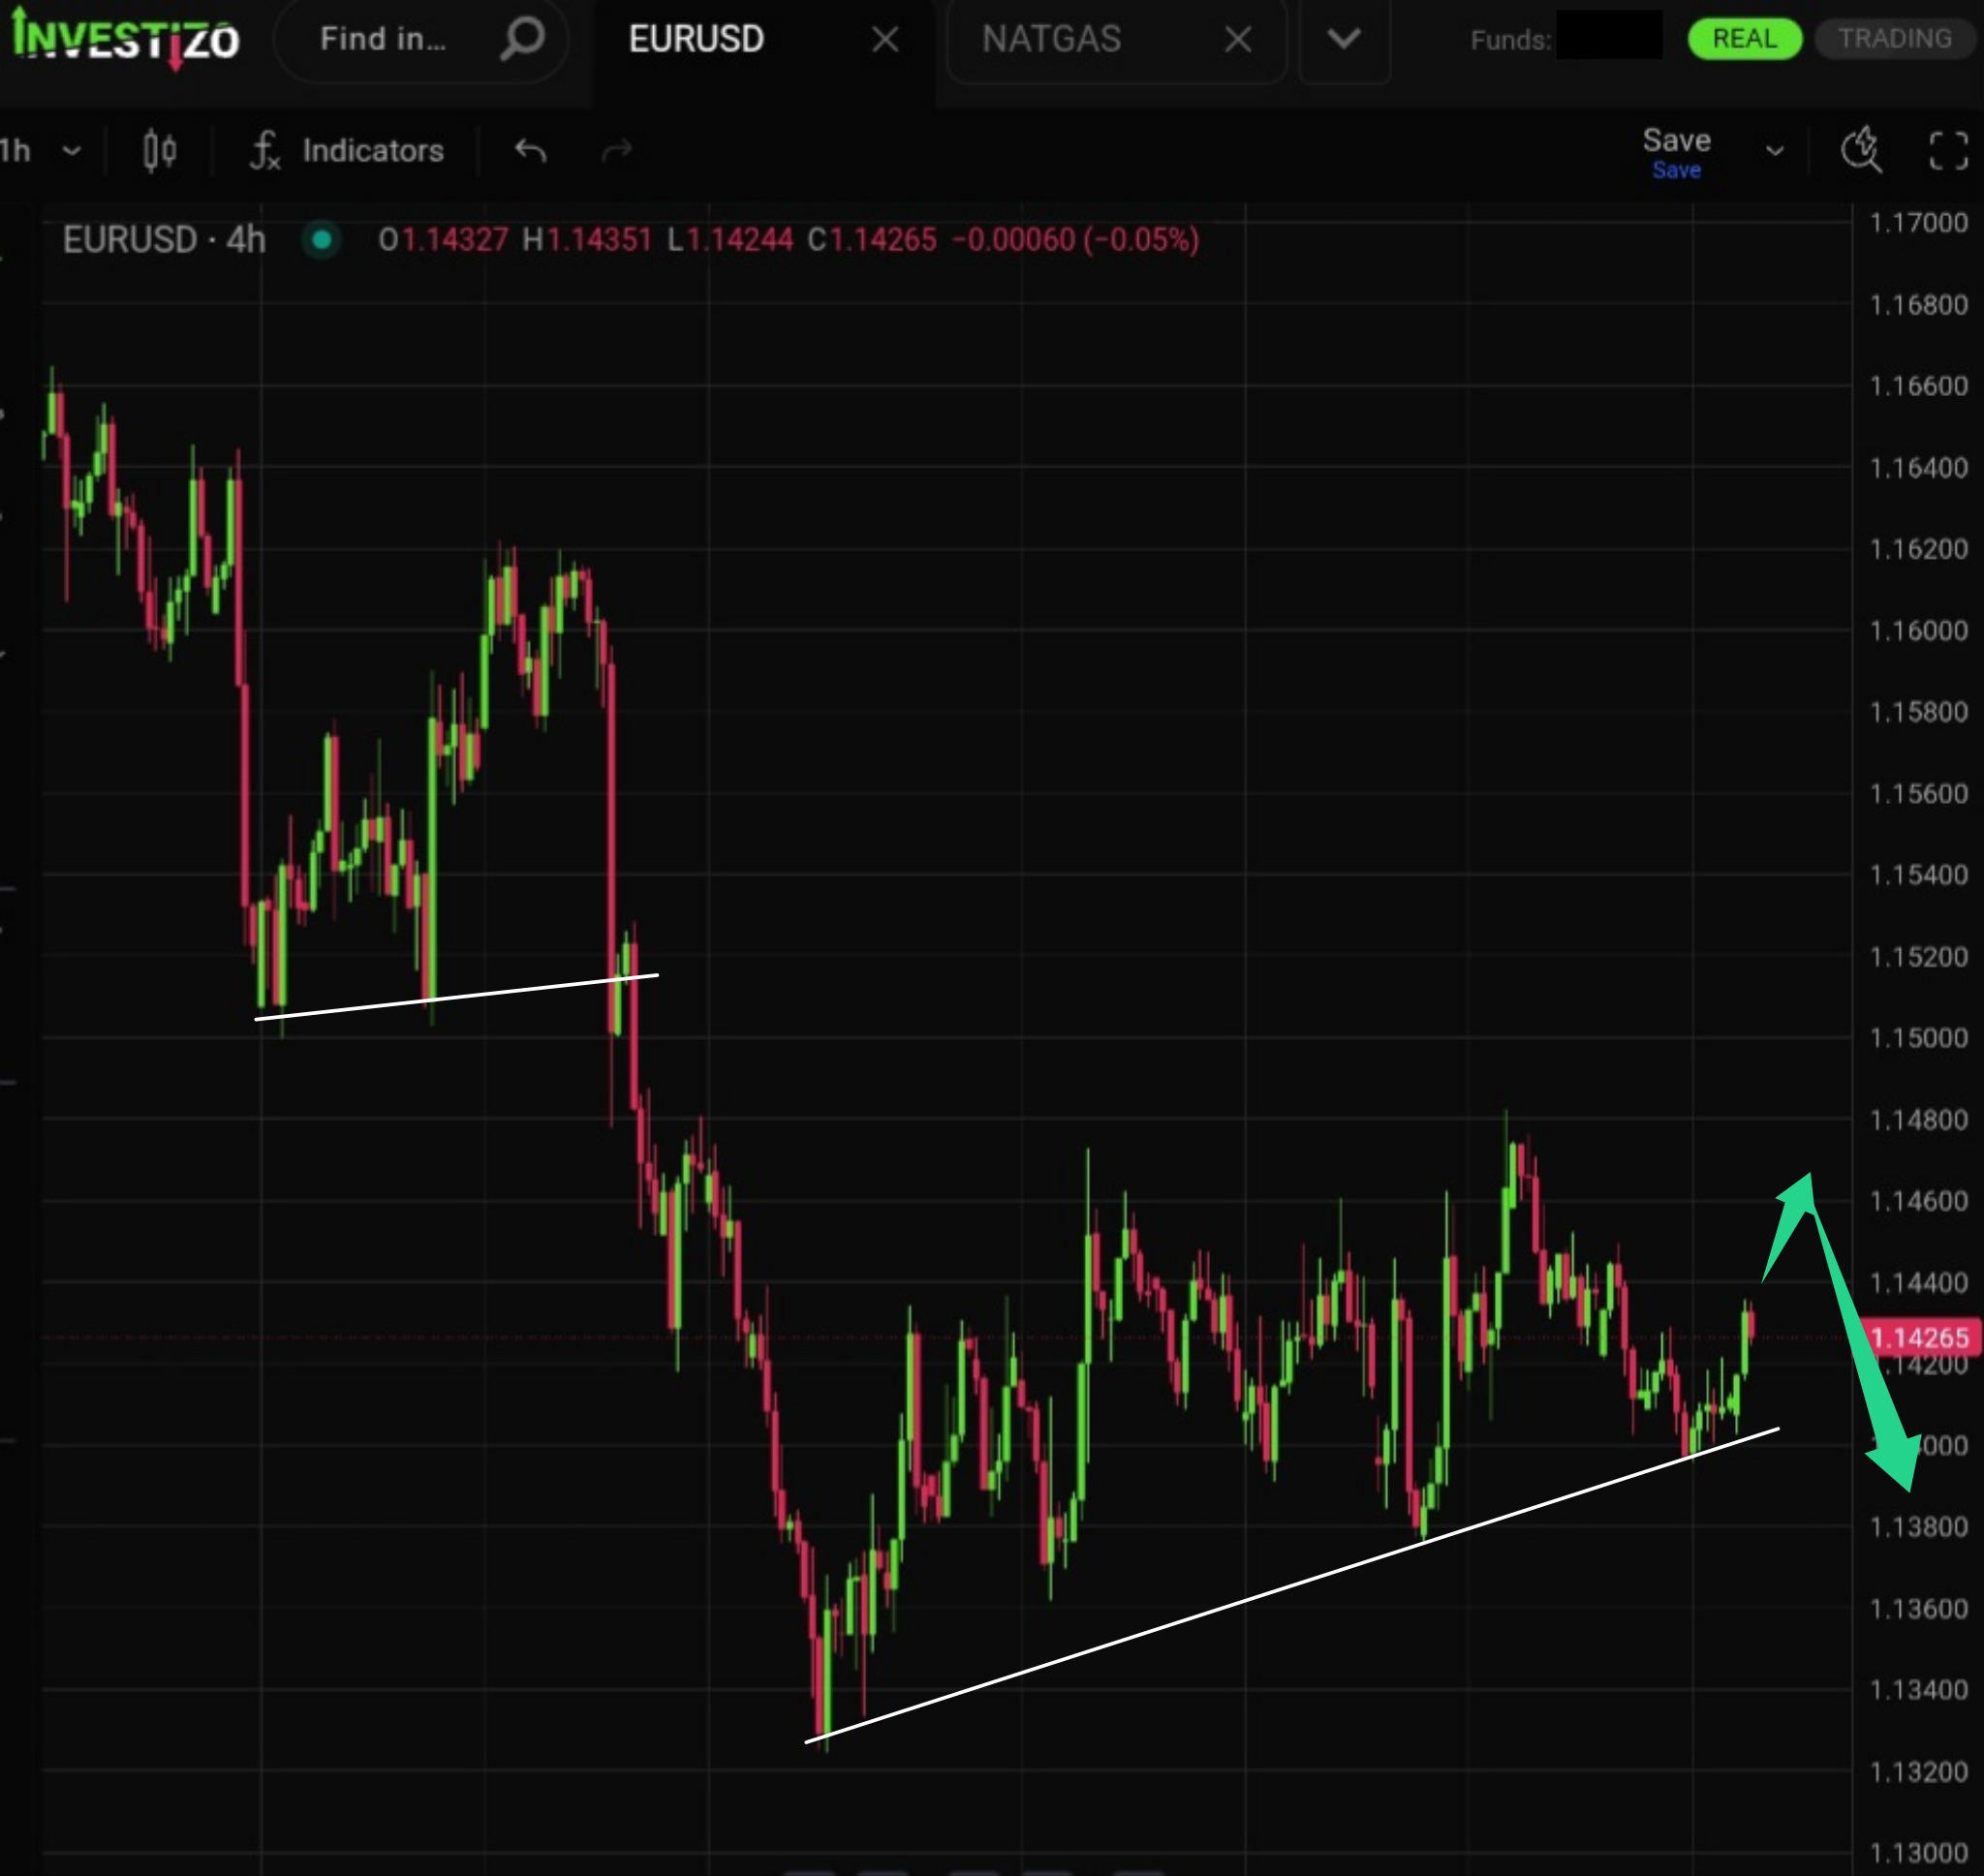
What we had anticipated for nearly a week has materialized: bears have broken through the sloping support near 1.1400.
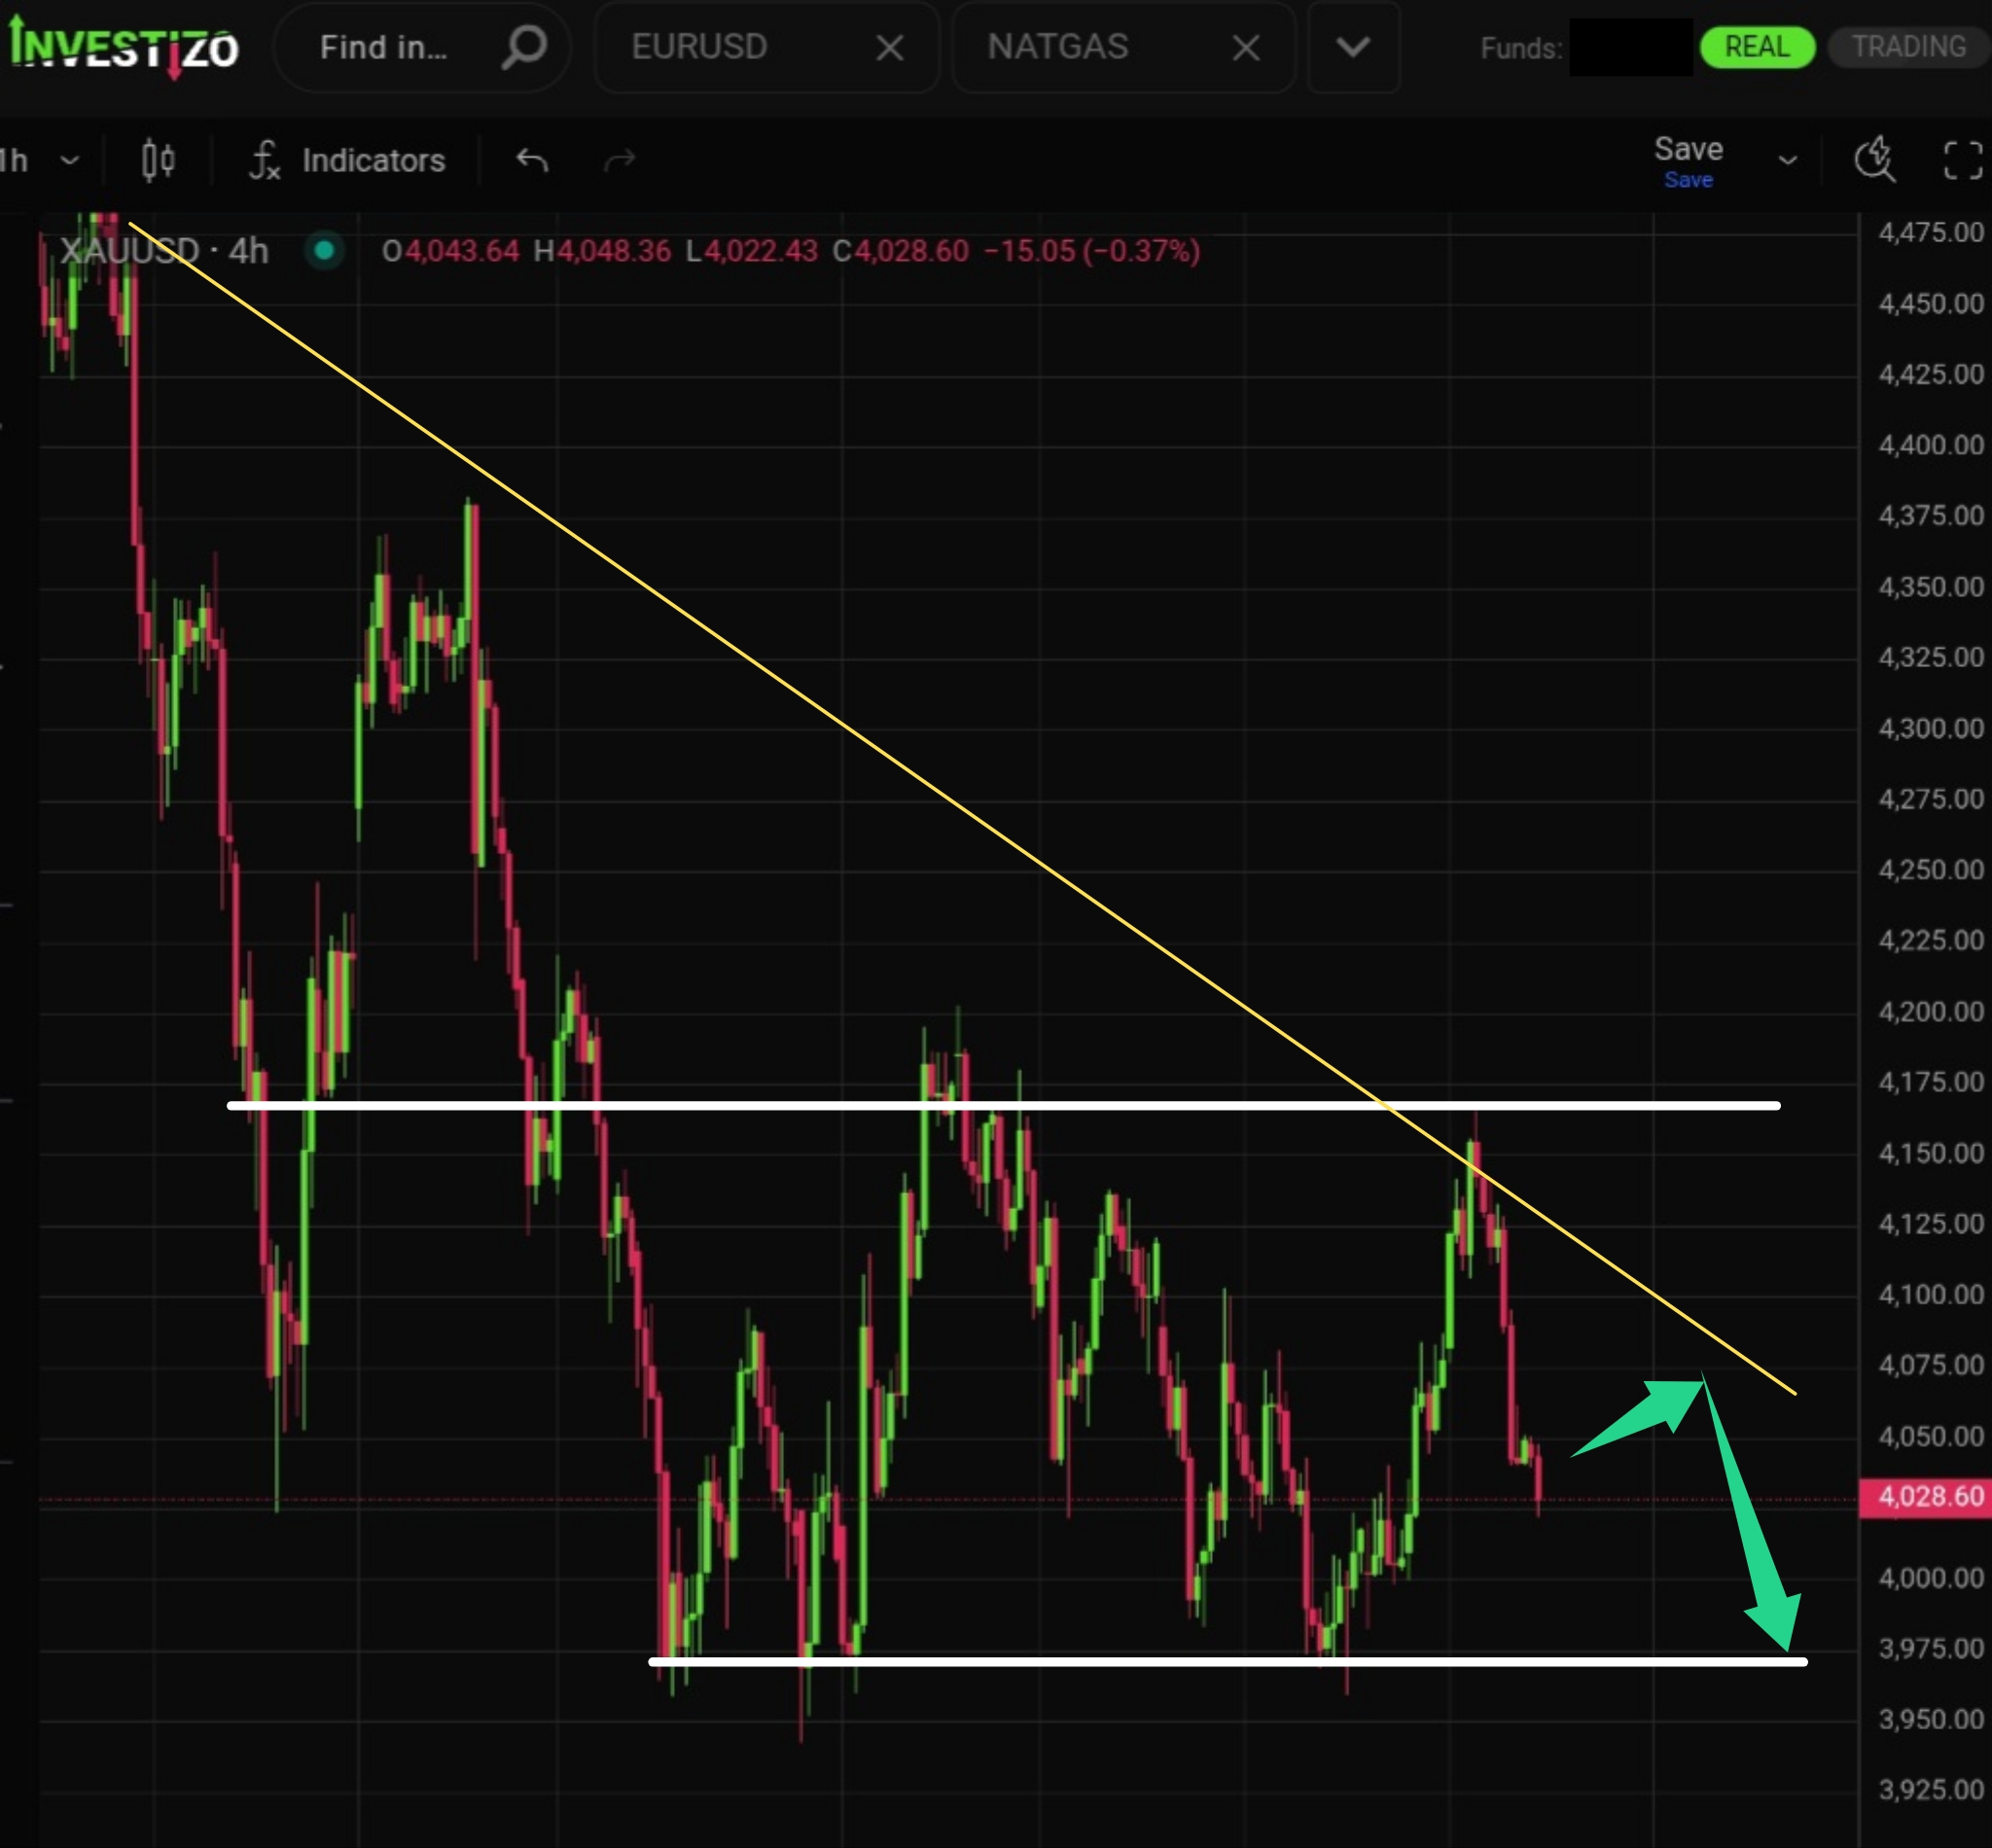
Gold trades at $4,028 per ounce this Friday morning, facing modest near-term headwinds as a firming US Dollar exerts downward pressure across the precious metals complex
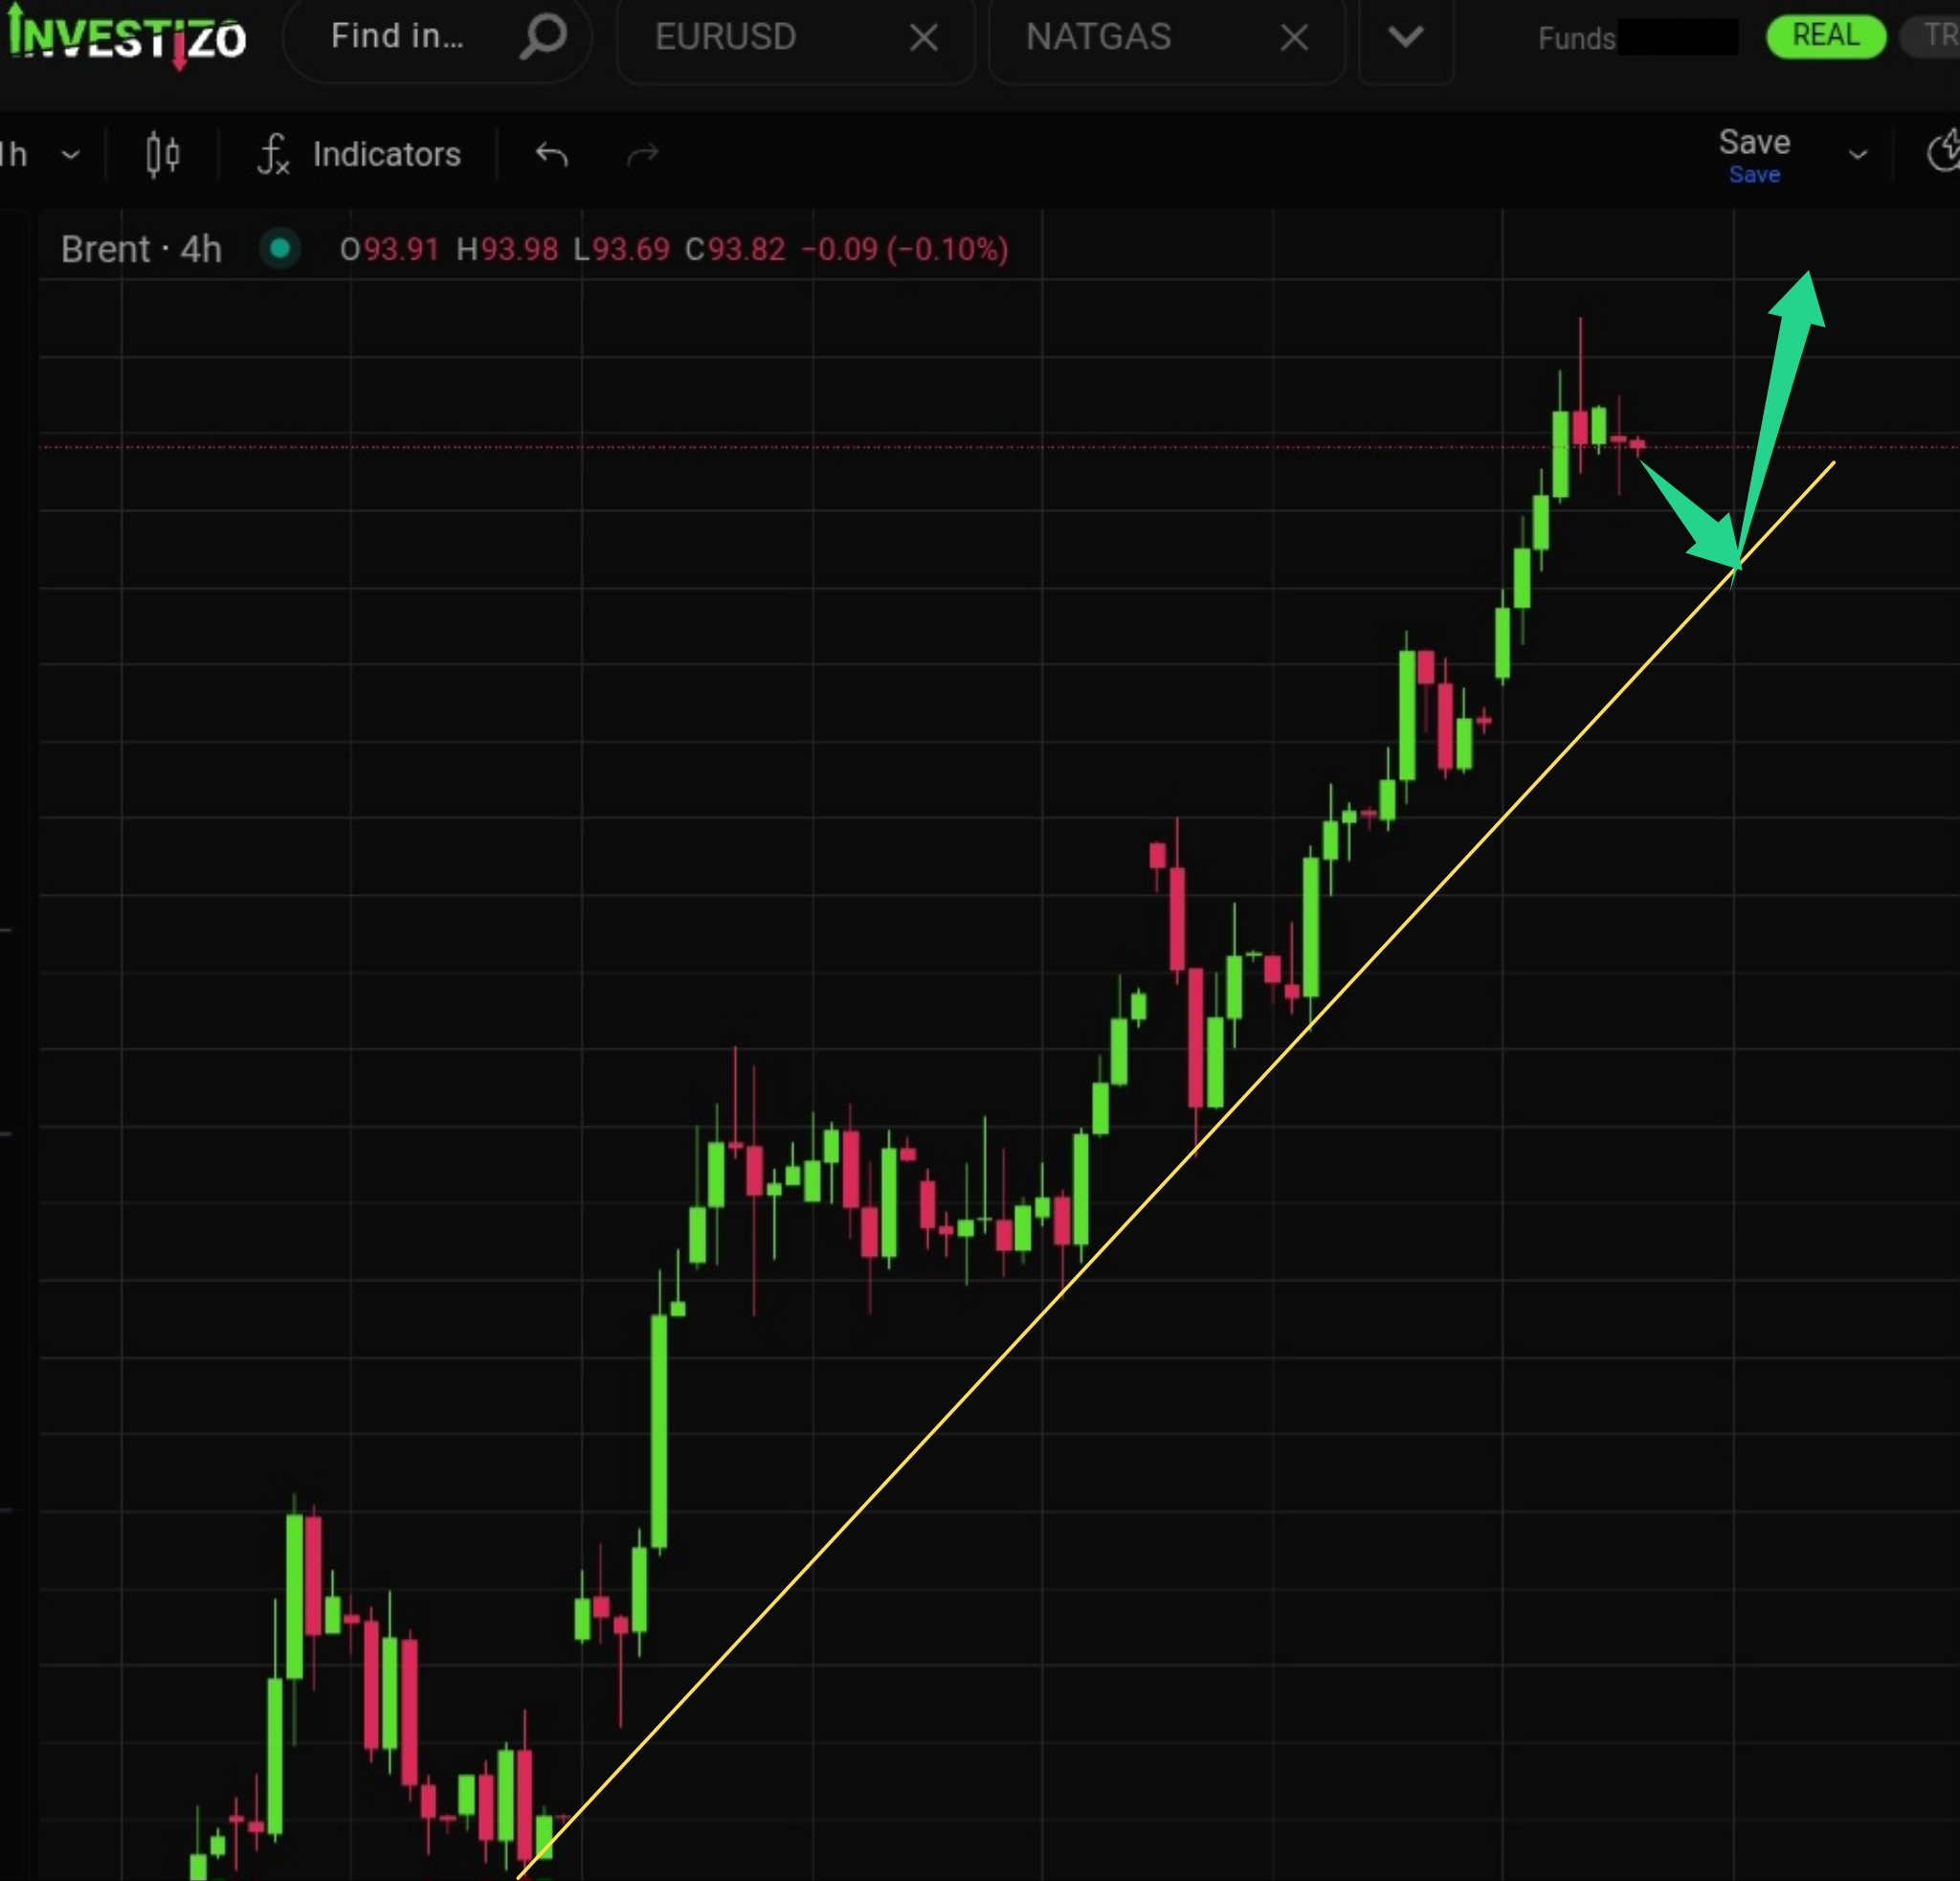
Brent Crude trades above 100.00 per barrel this Friday morning, entering three-digit territory as unprecedented supply risks engulf all primary Middle Eastern maritime corridors.
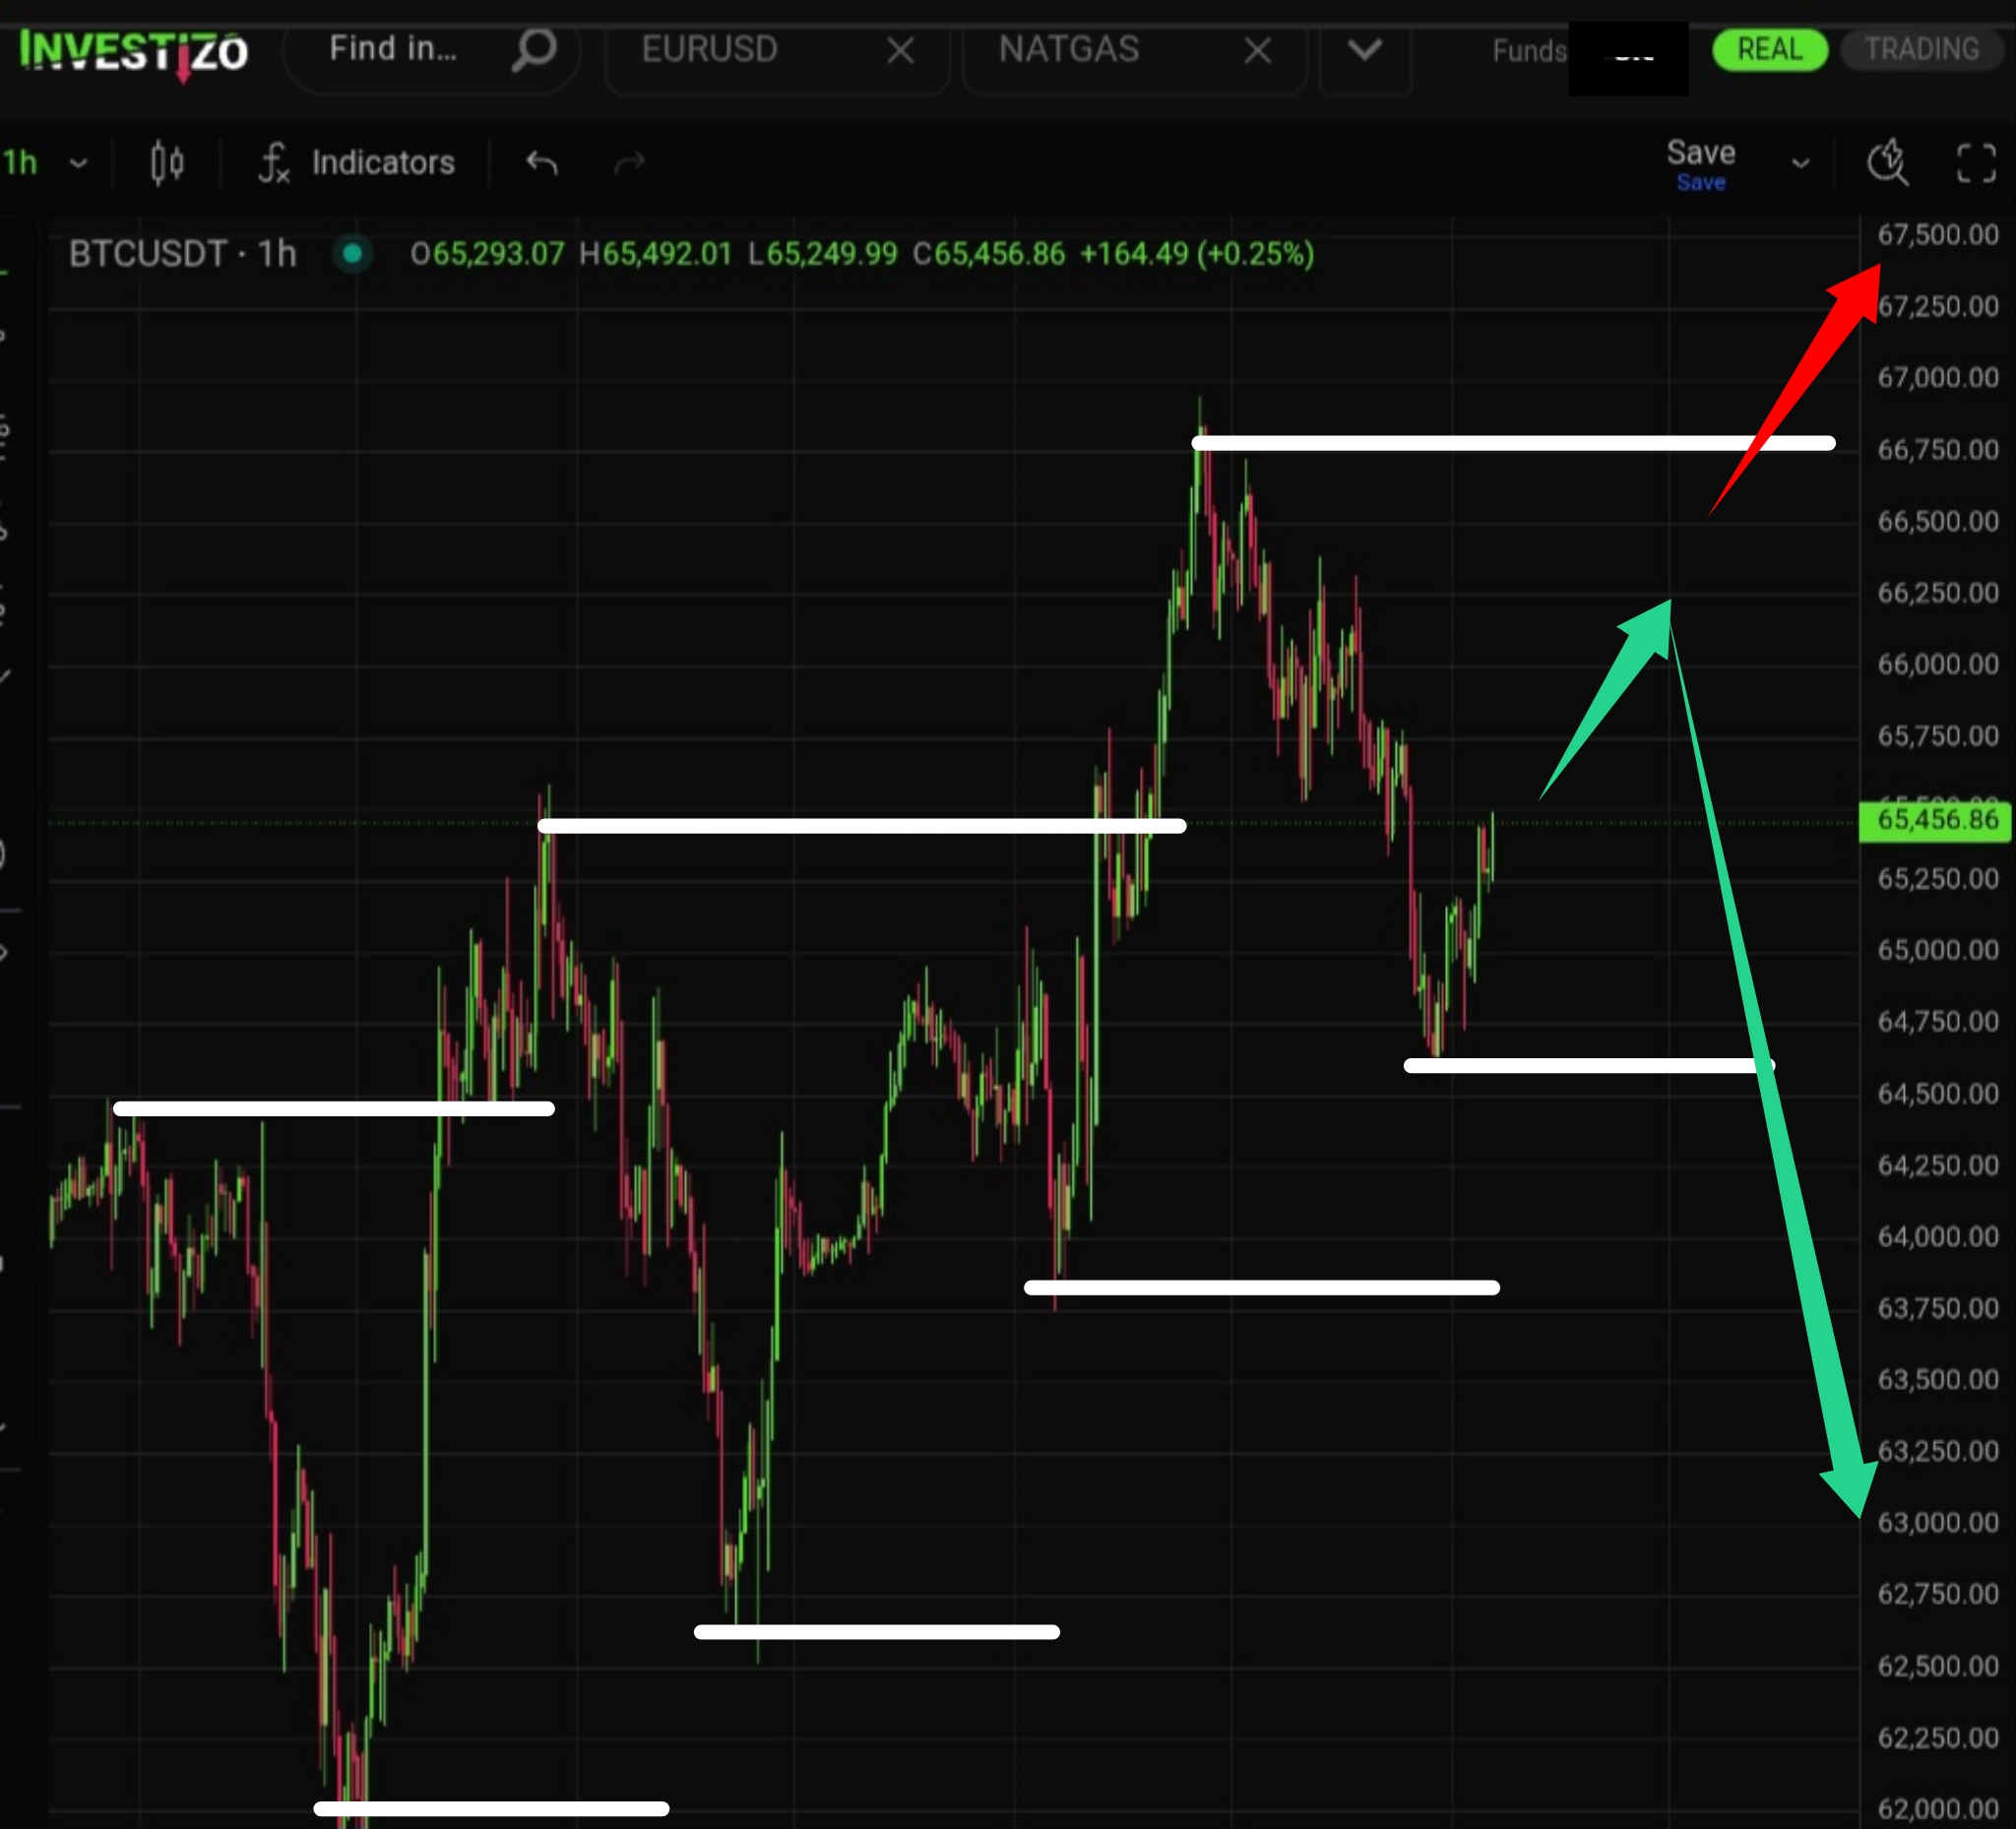
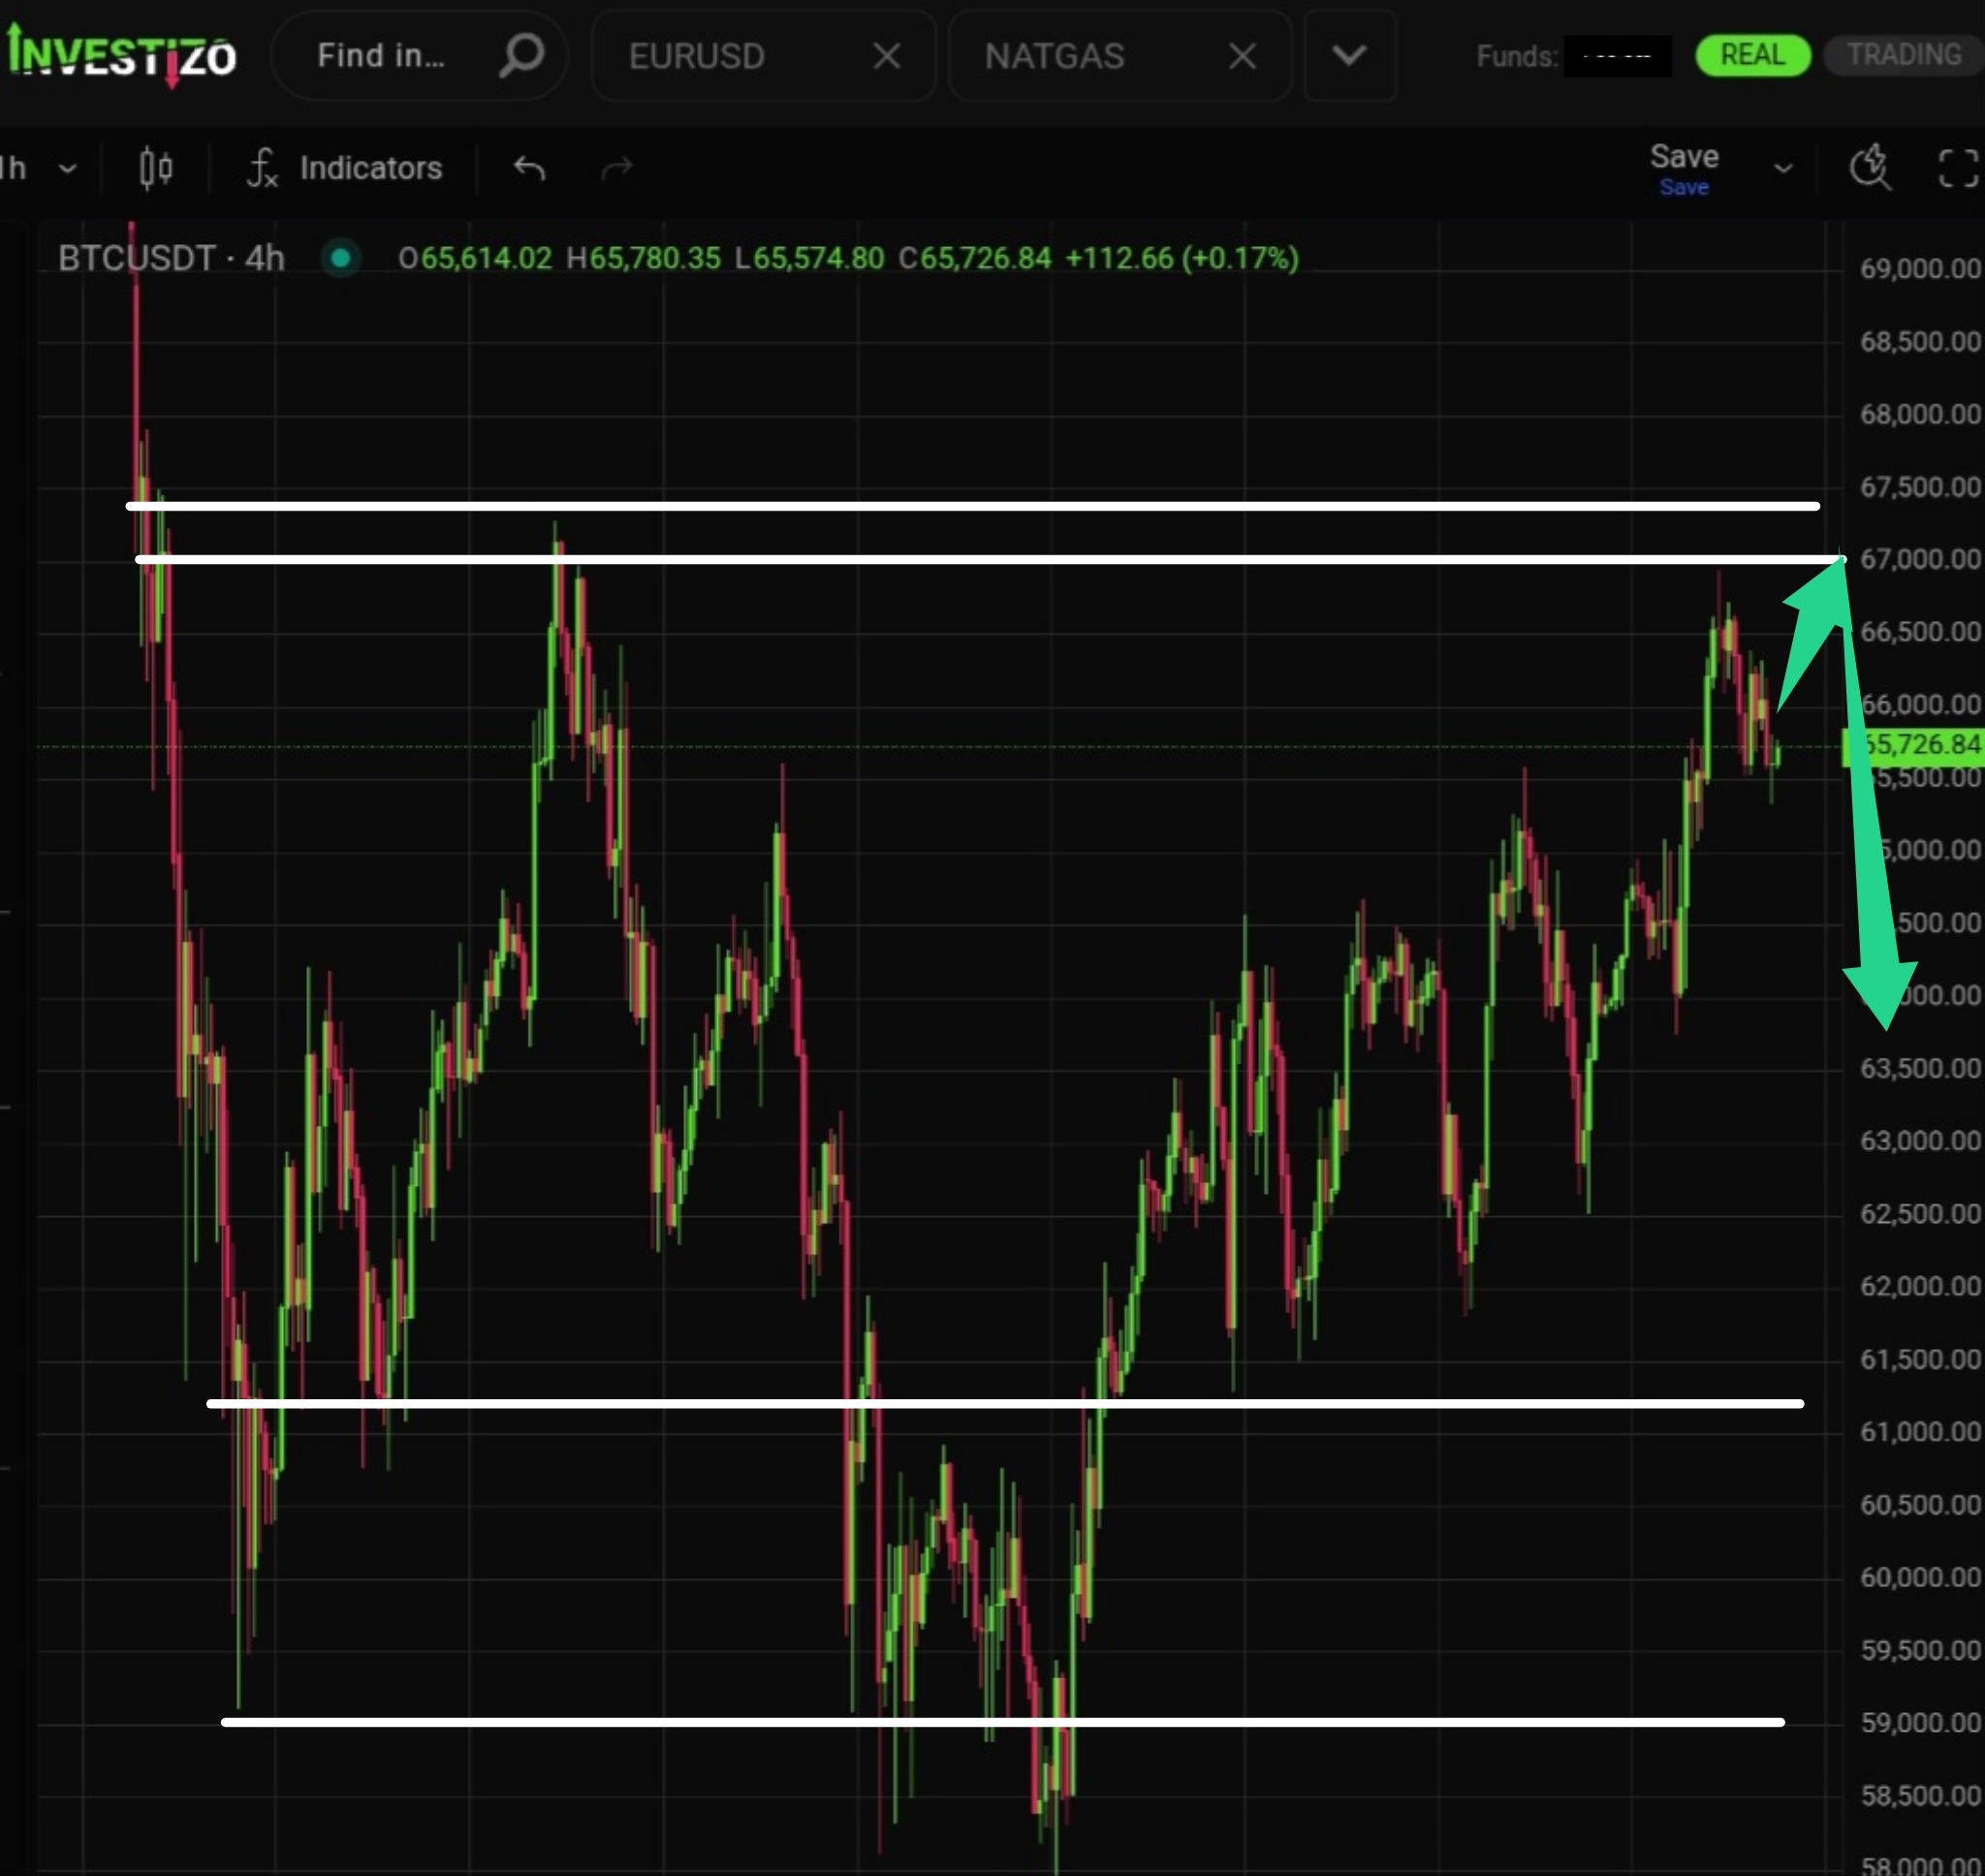
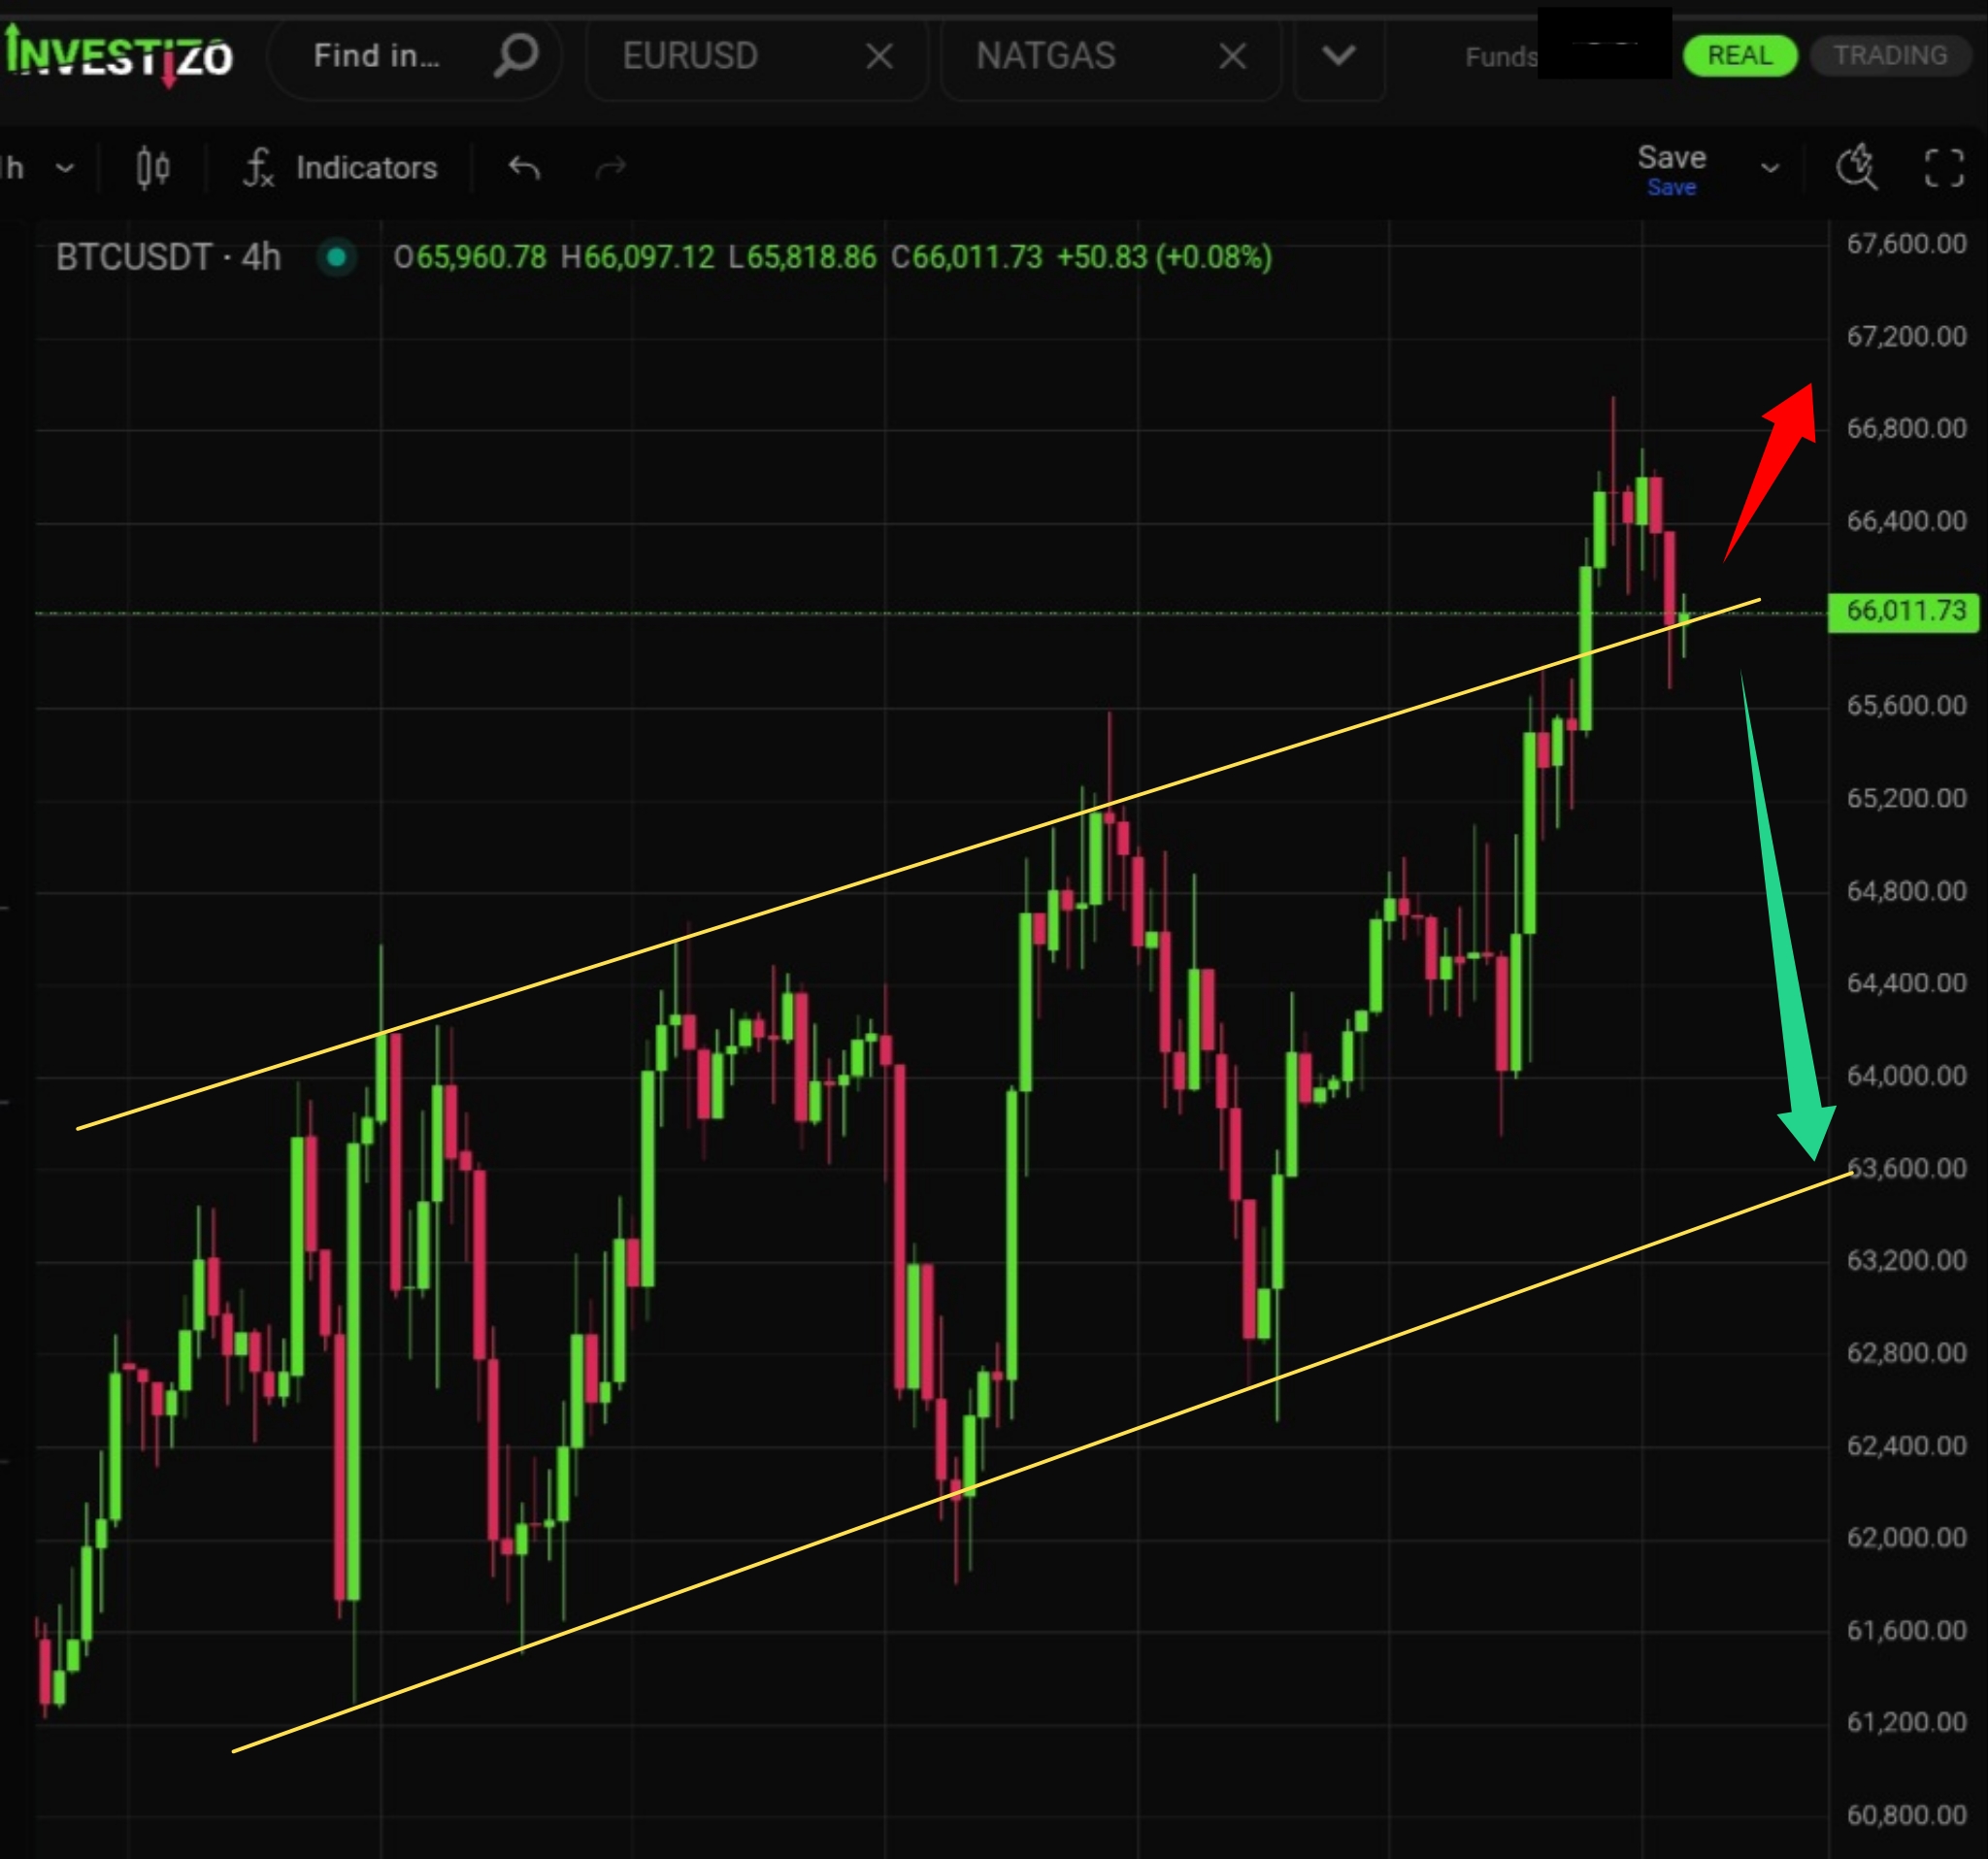
Bitcoin is consolidating just below a massive solid concrete resistance in the $67,000–67,500 zone.
The overall structure remains bullish, as evidenced by consistently higher lows. However, the price action has also shown notable deterioration.
The price is approaching the upper boundary of the “megaphone” (horn) pattern we highlighted yesterday.
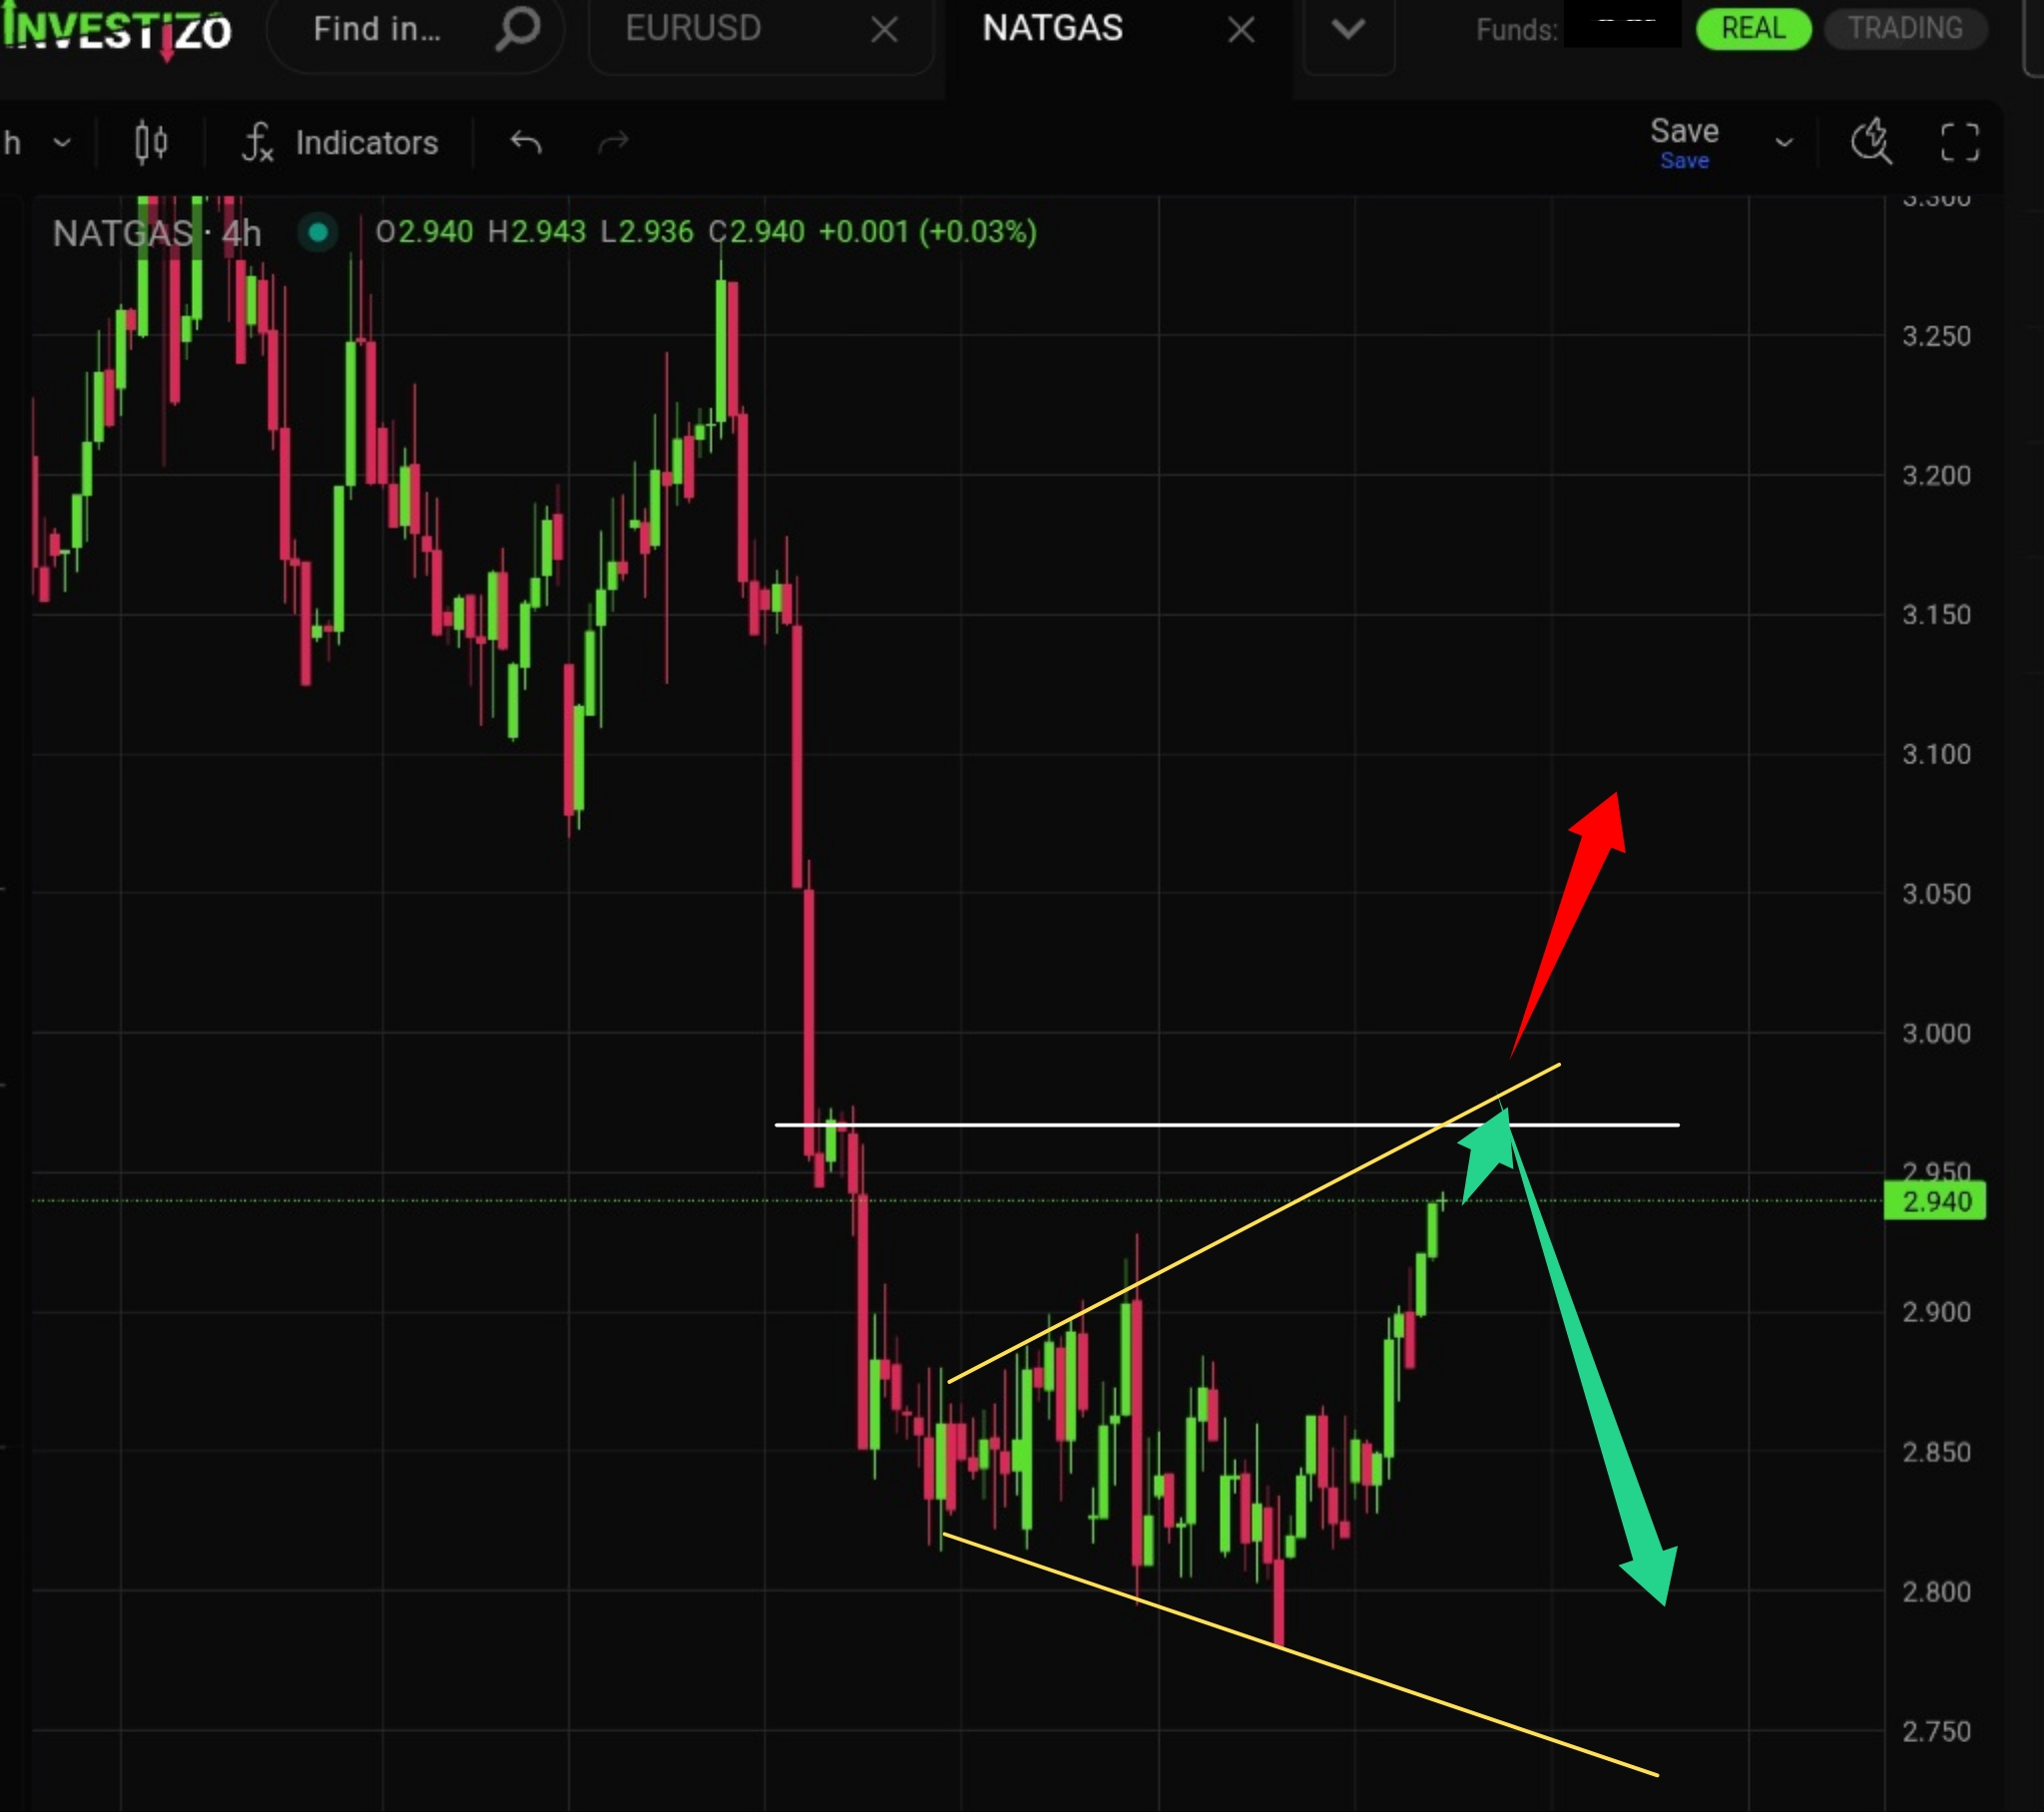
A bullish continuation pattern (“bull pennant”) has formed, suggesting further upside momentum.
The pair continues to form a local consolidation channel, confirming bearish control over the market.
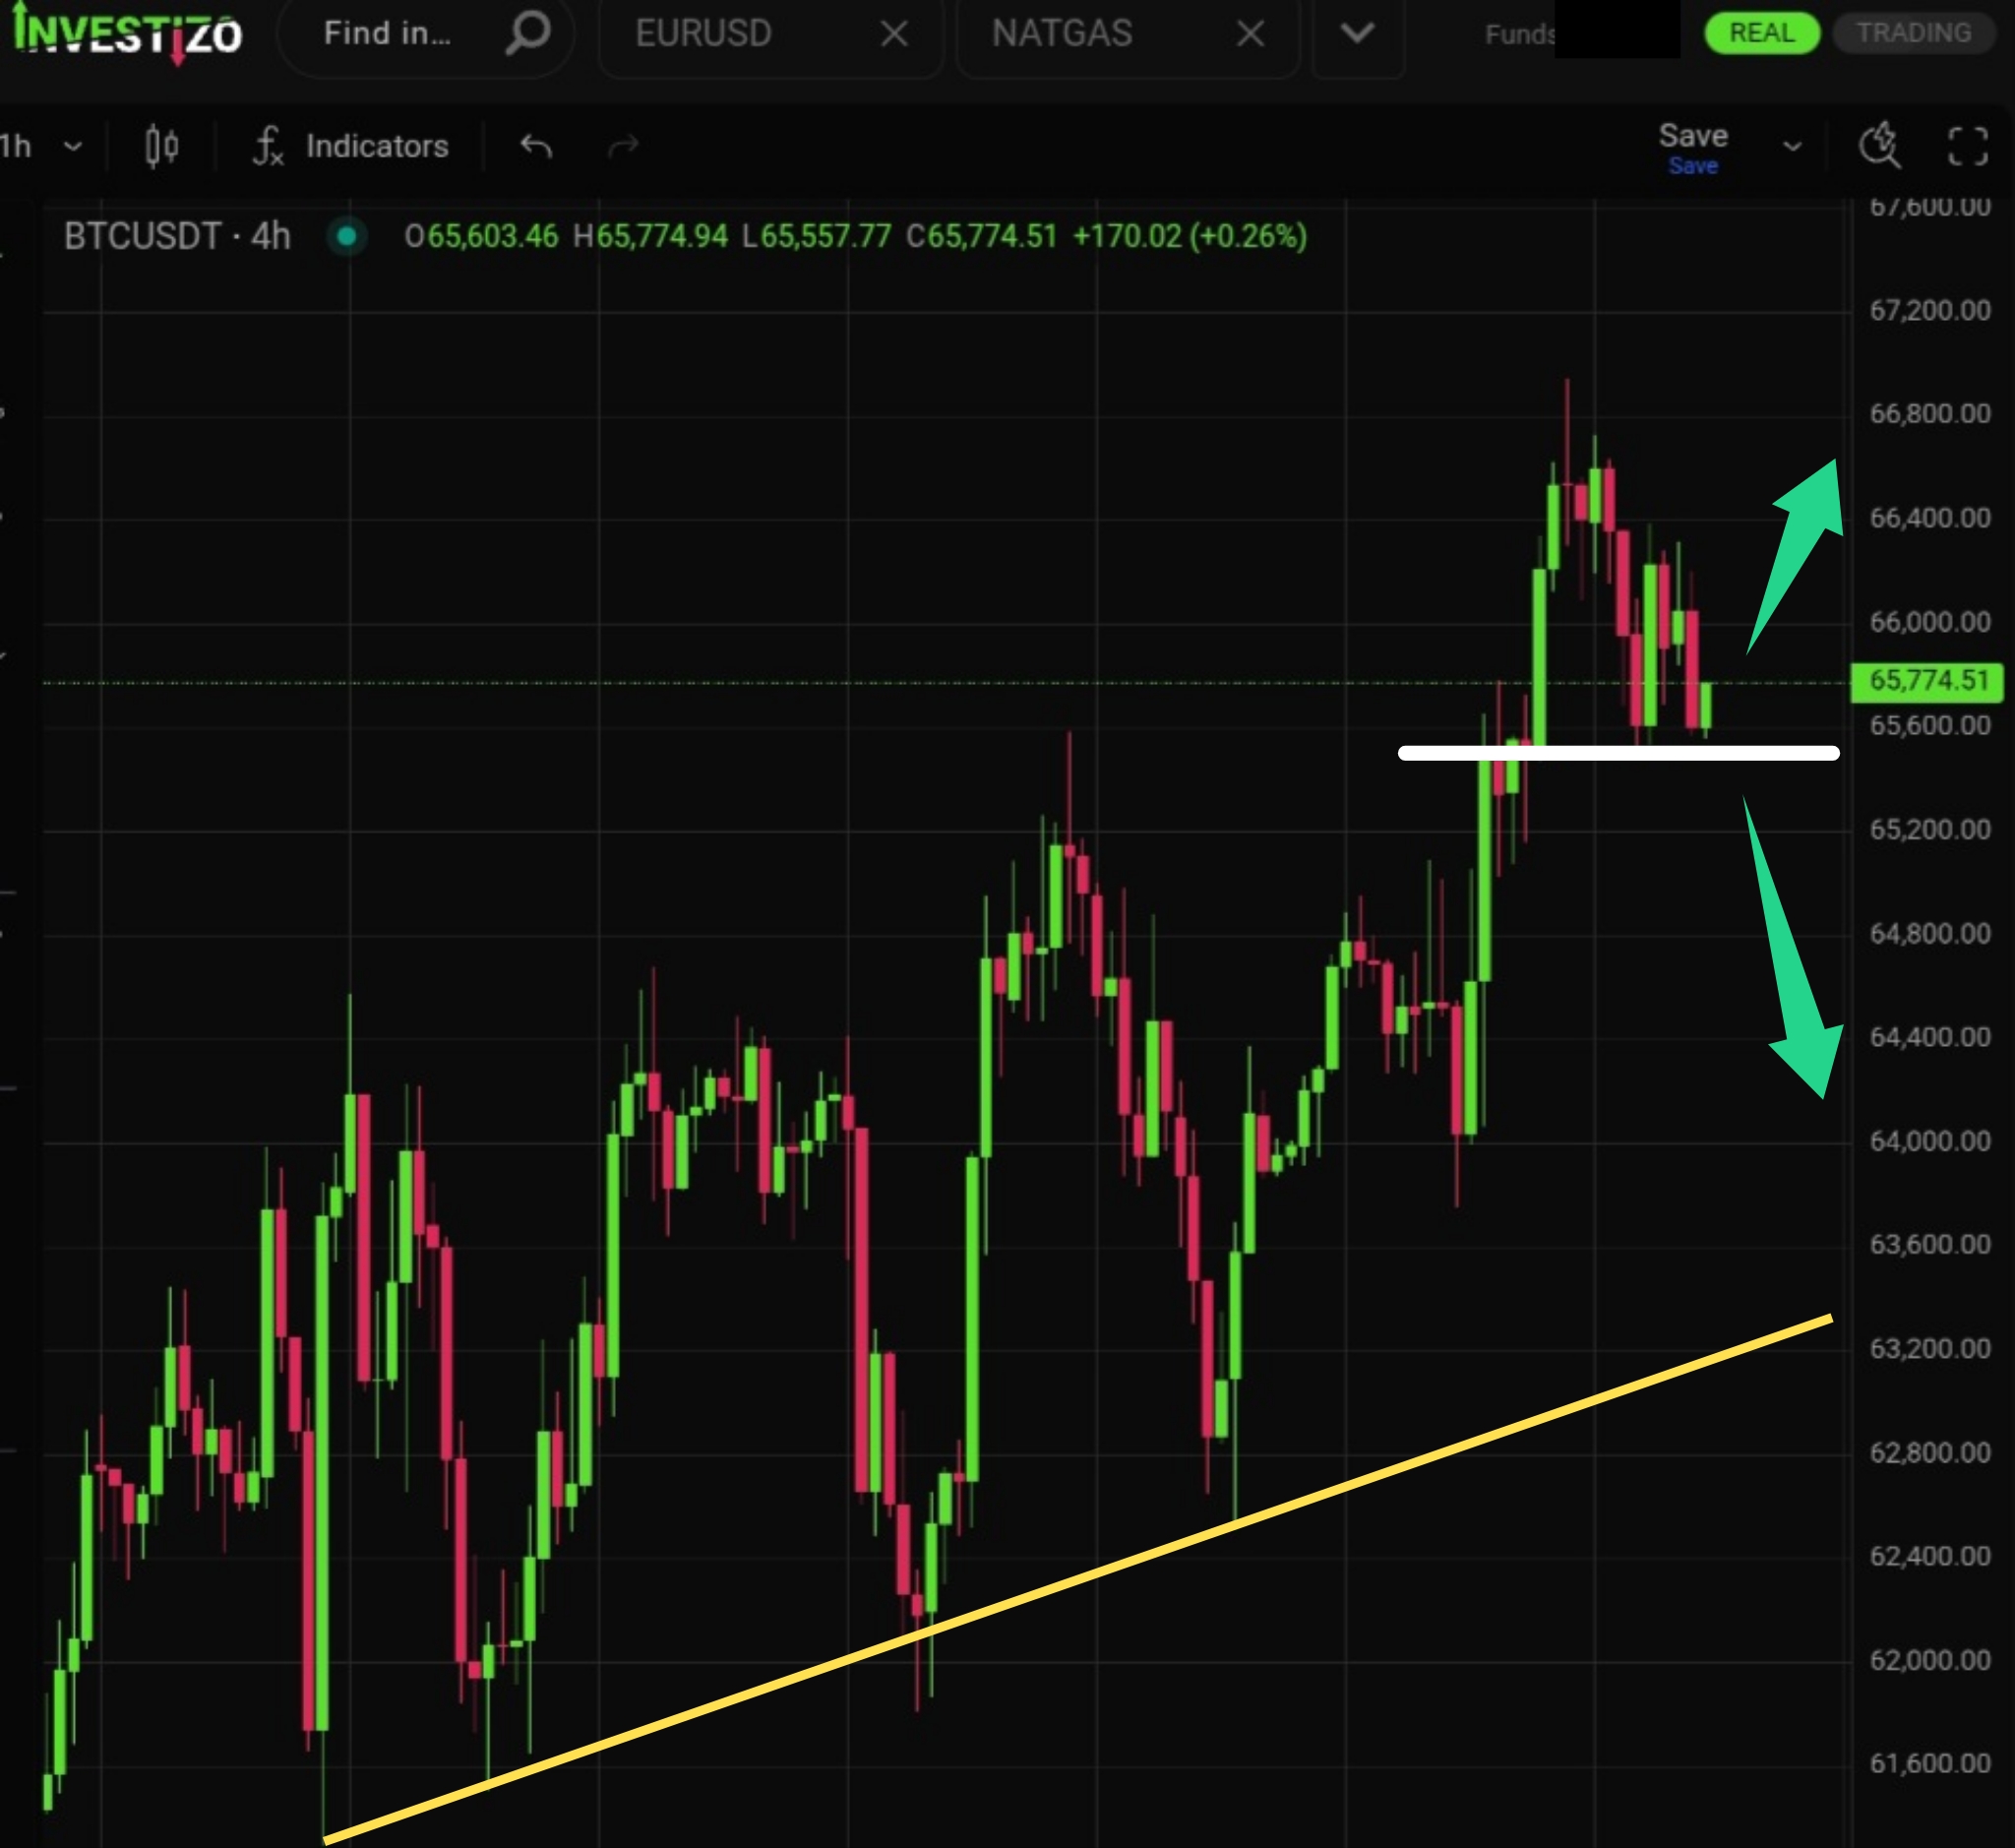
Bitcoin (BTC/USD) trades at 65,700 this Thursday morning, continuing to build a structural floor after gaining 11.5% from its June low.
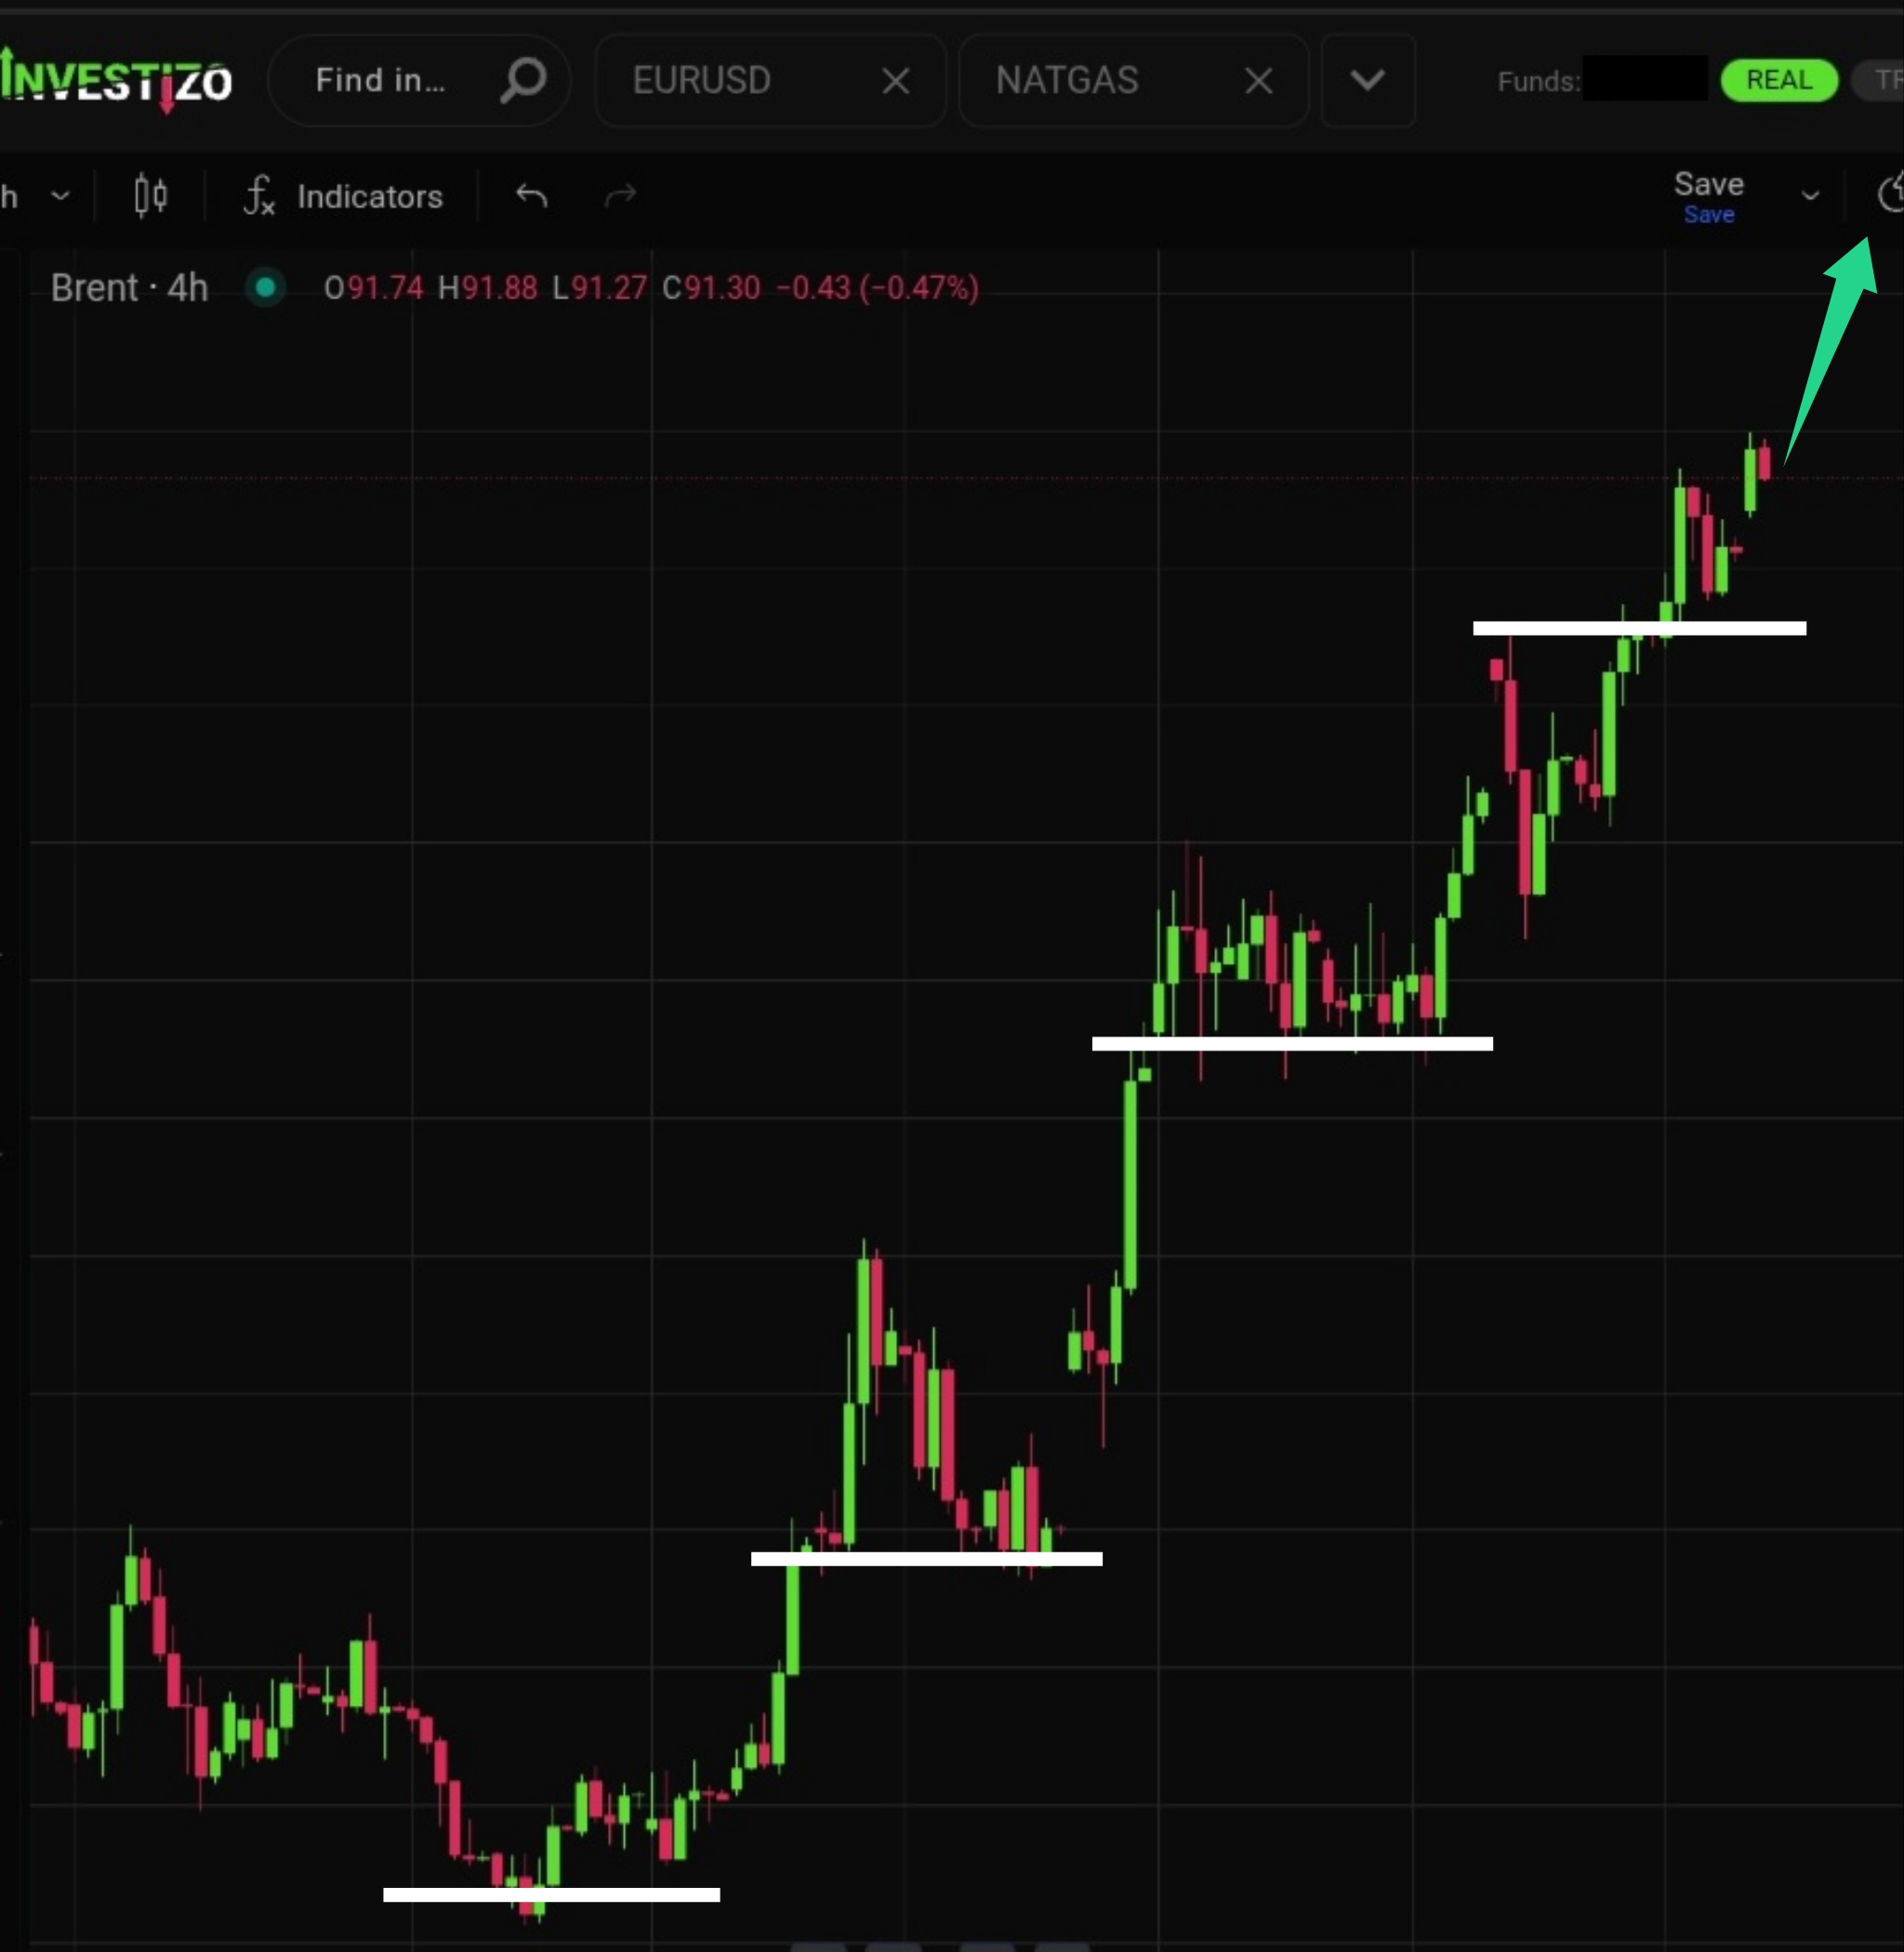
Brent Crude trades at 92.00 this Thursday morning, holding near its intra-session peak of 92.22 per barrel as mounting military tensions.
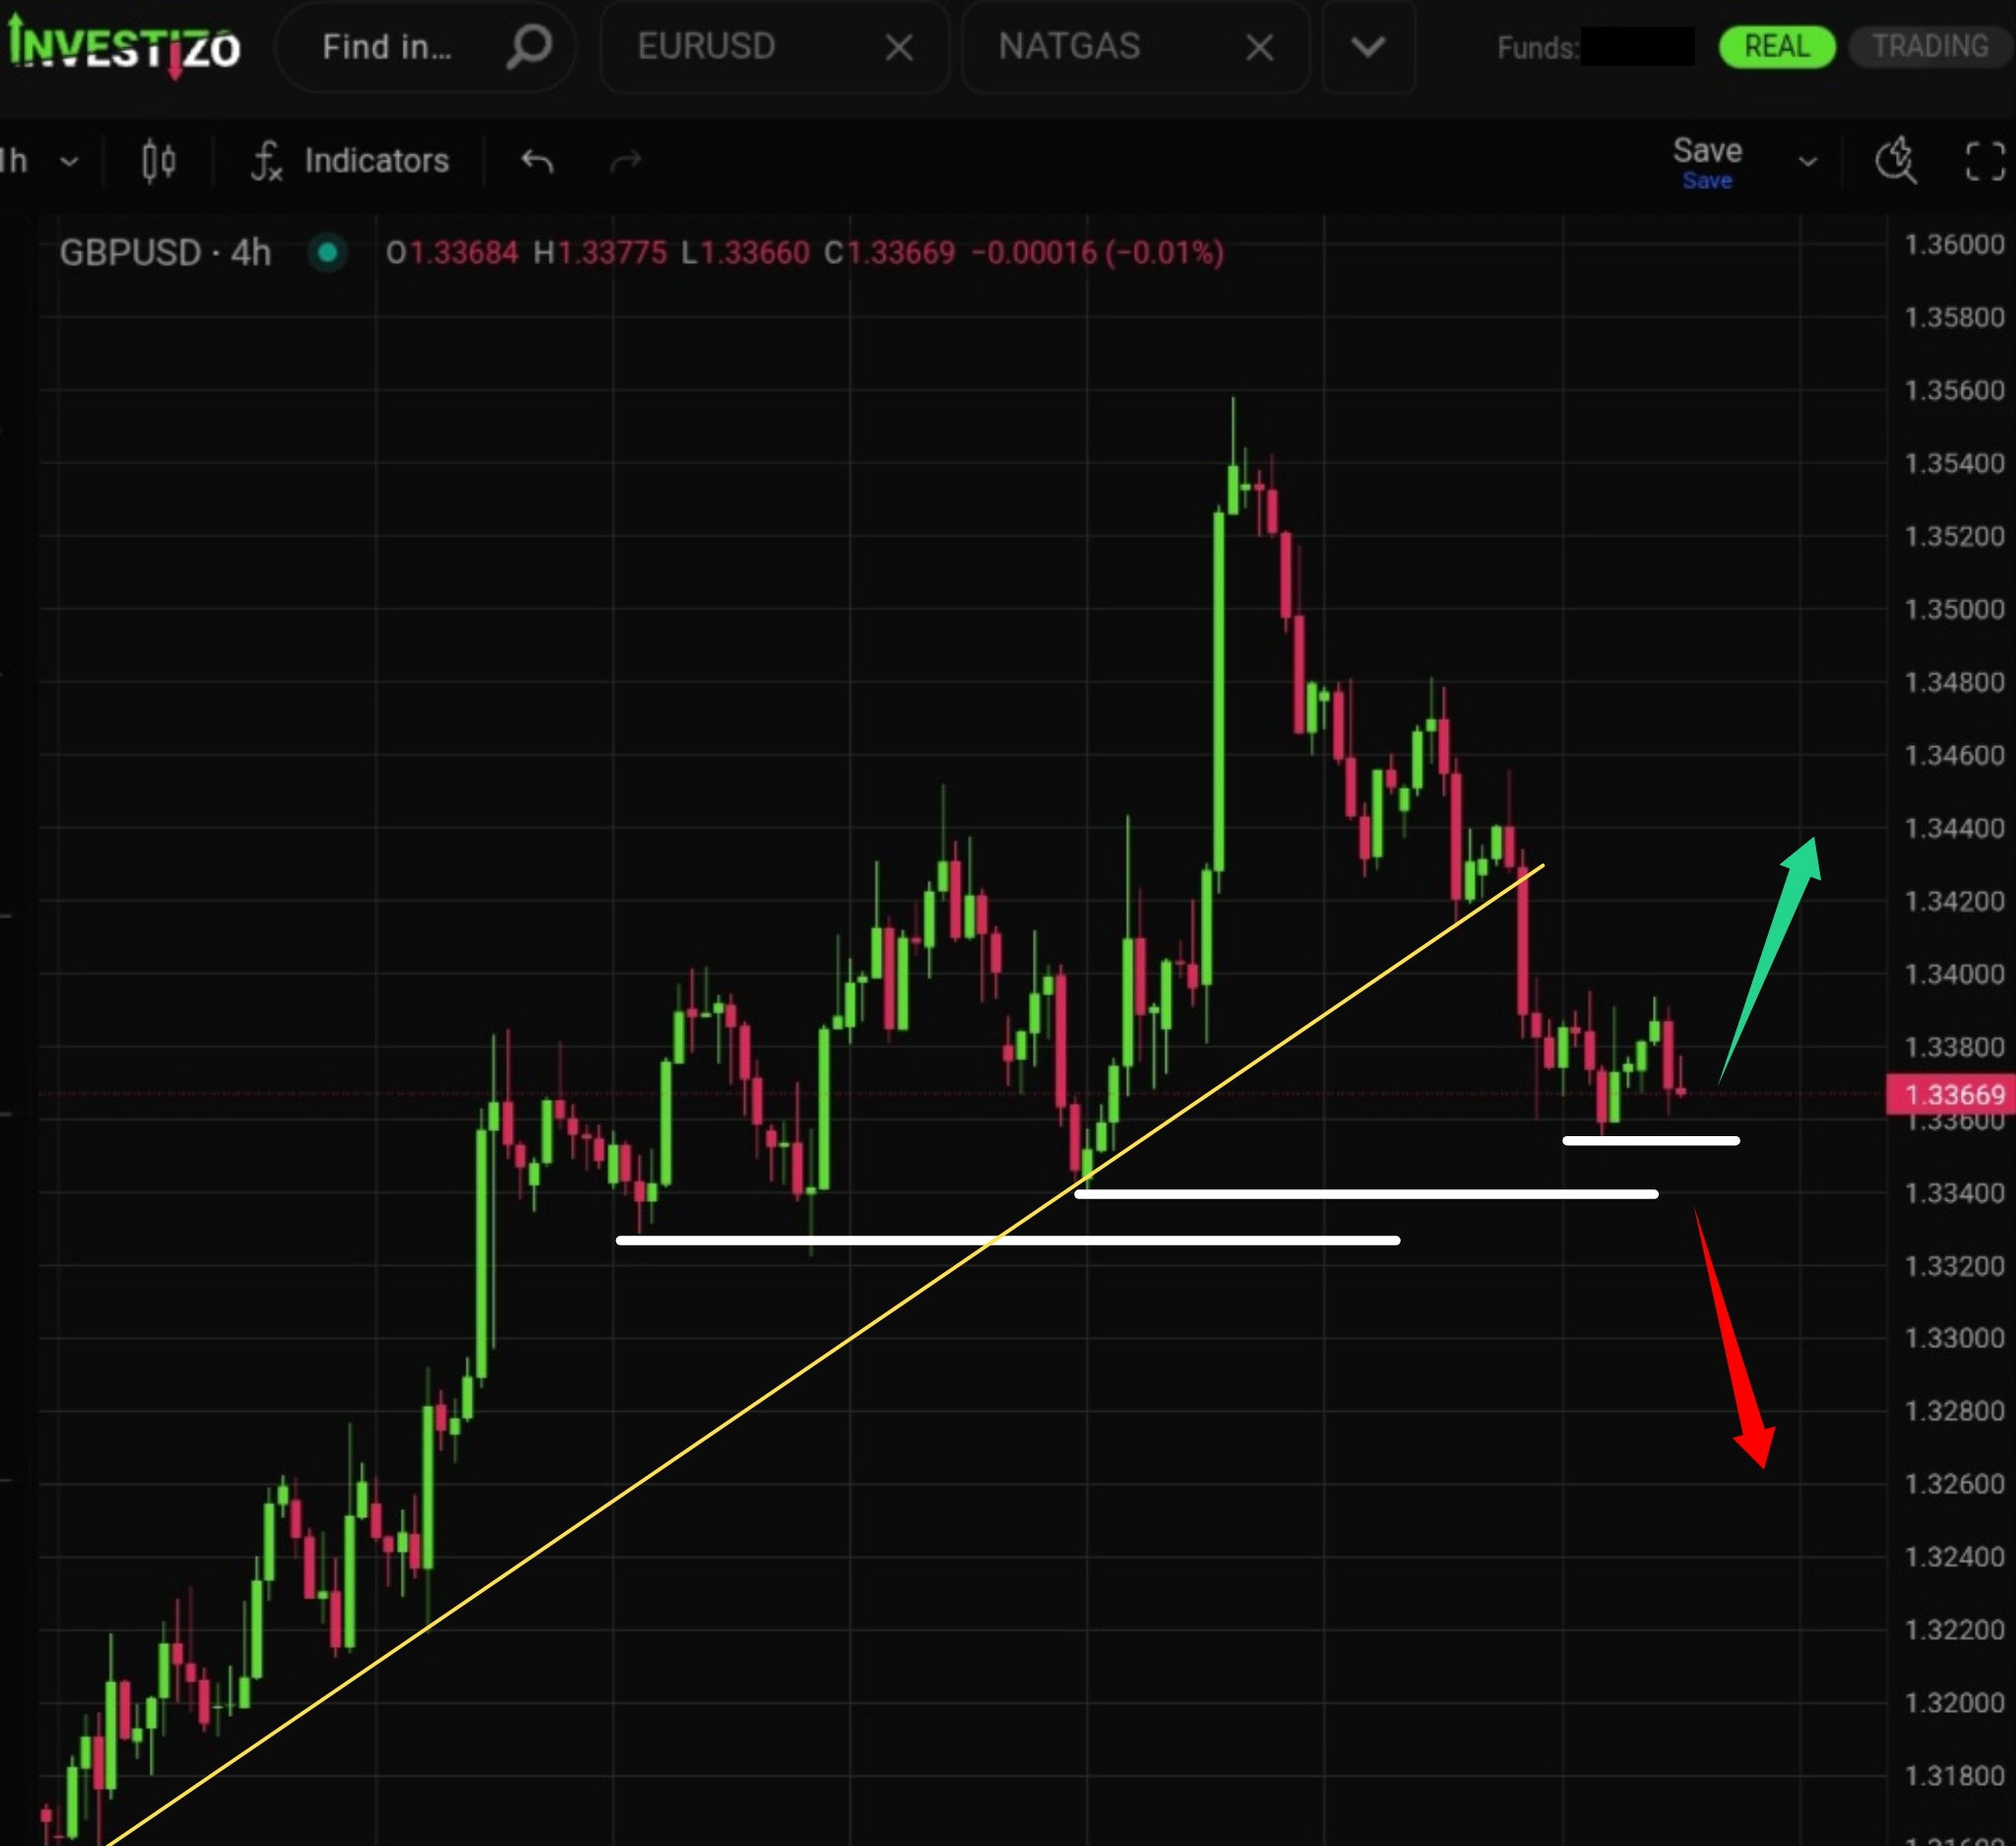
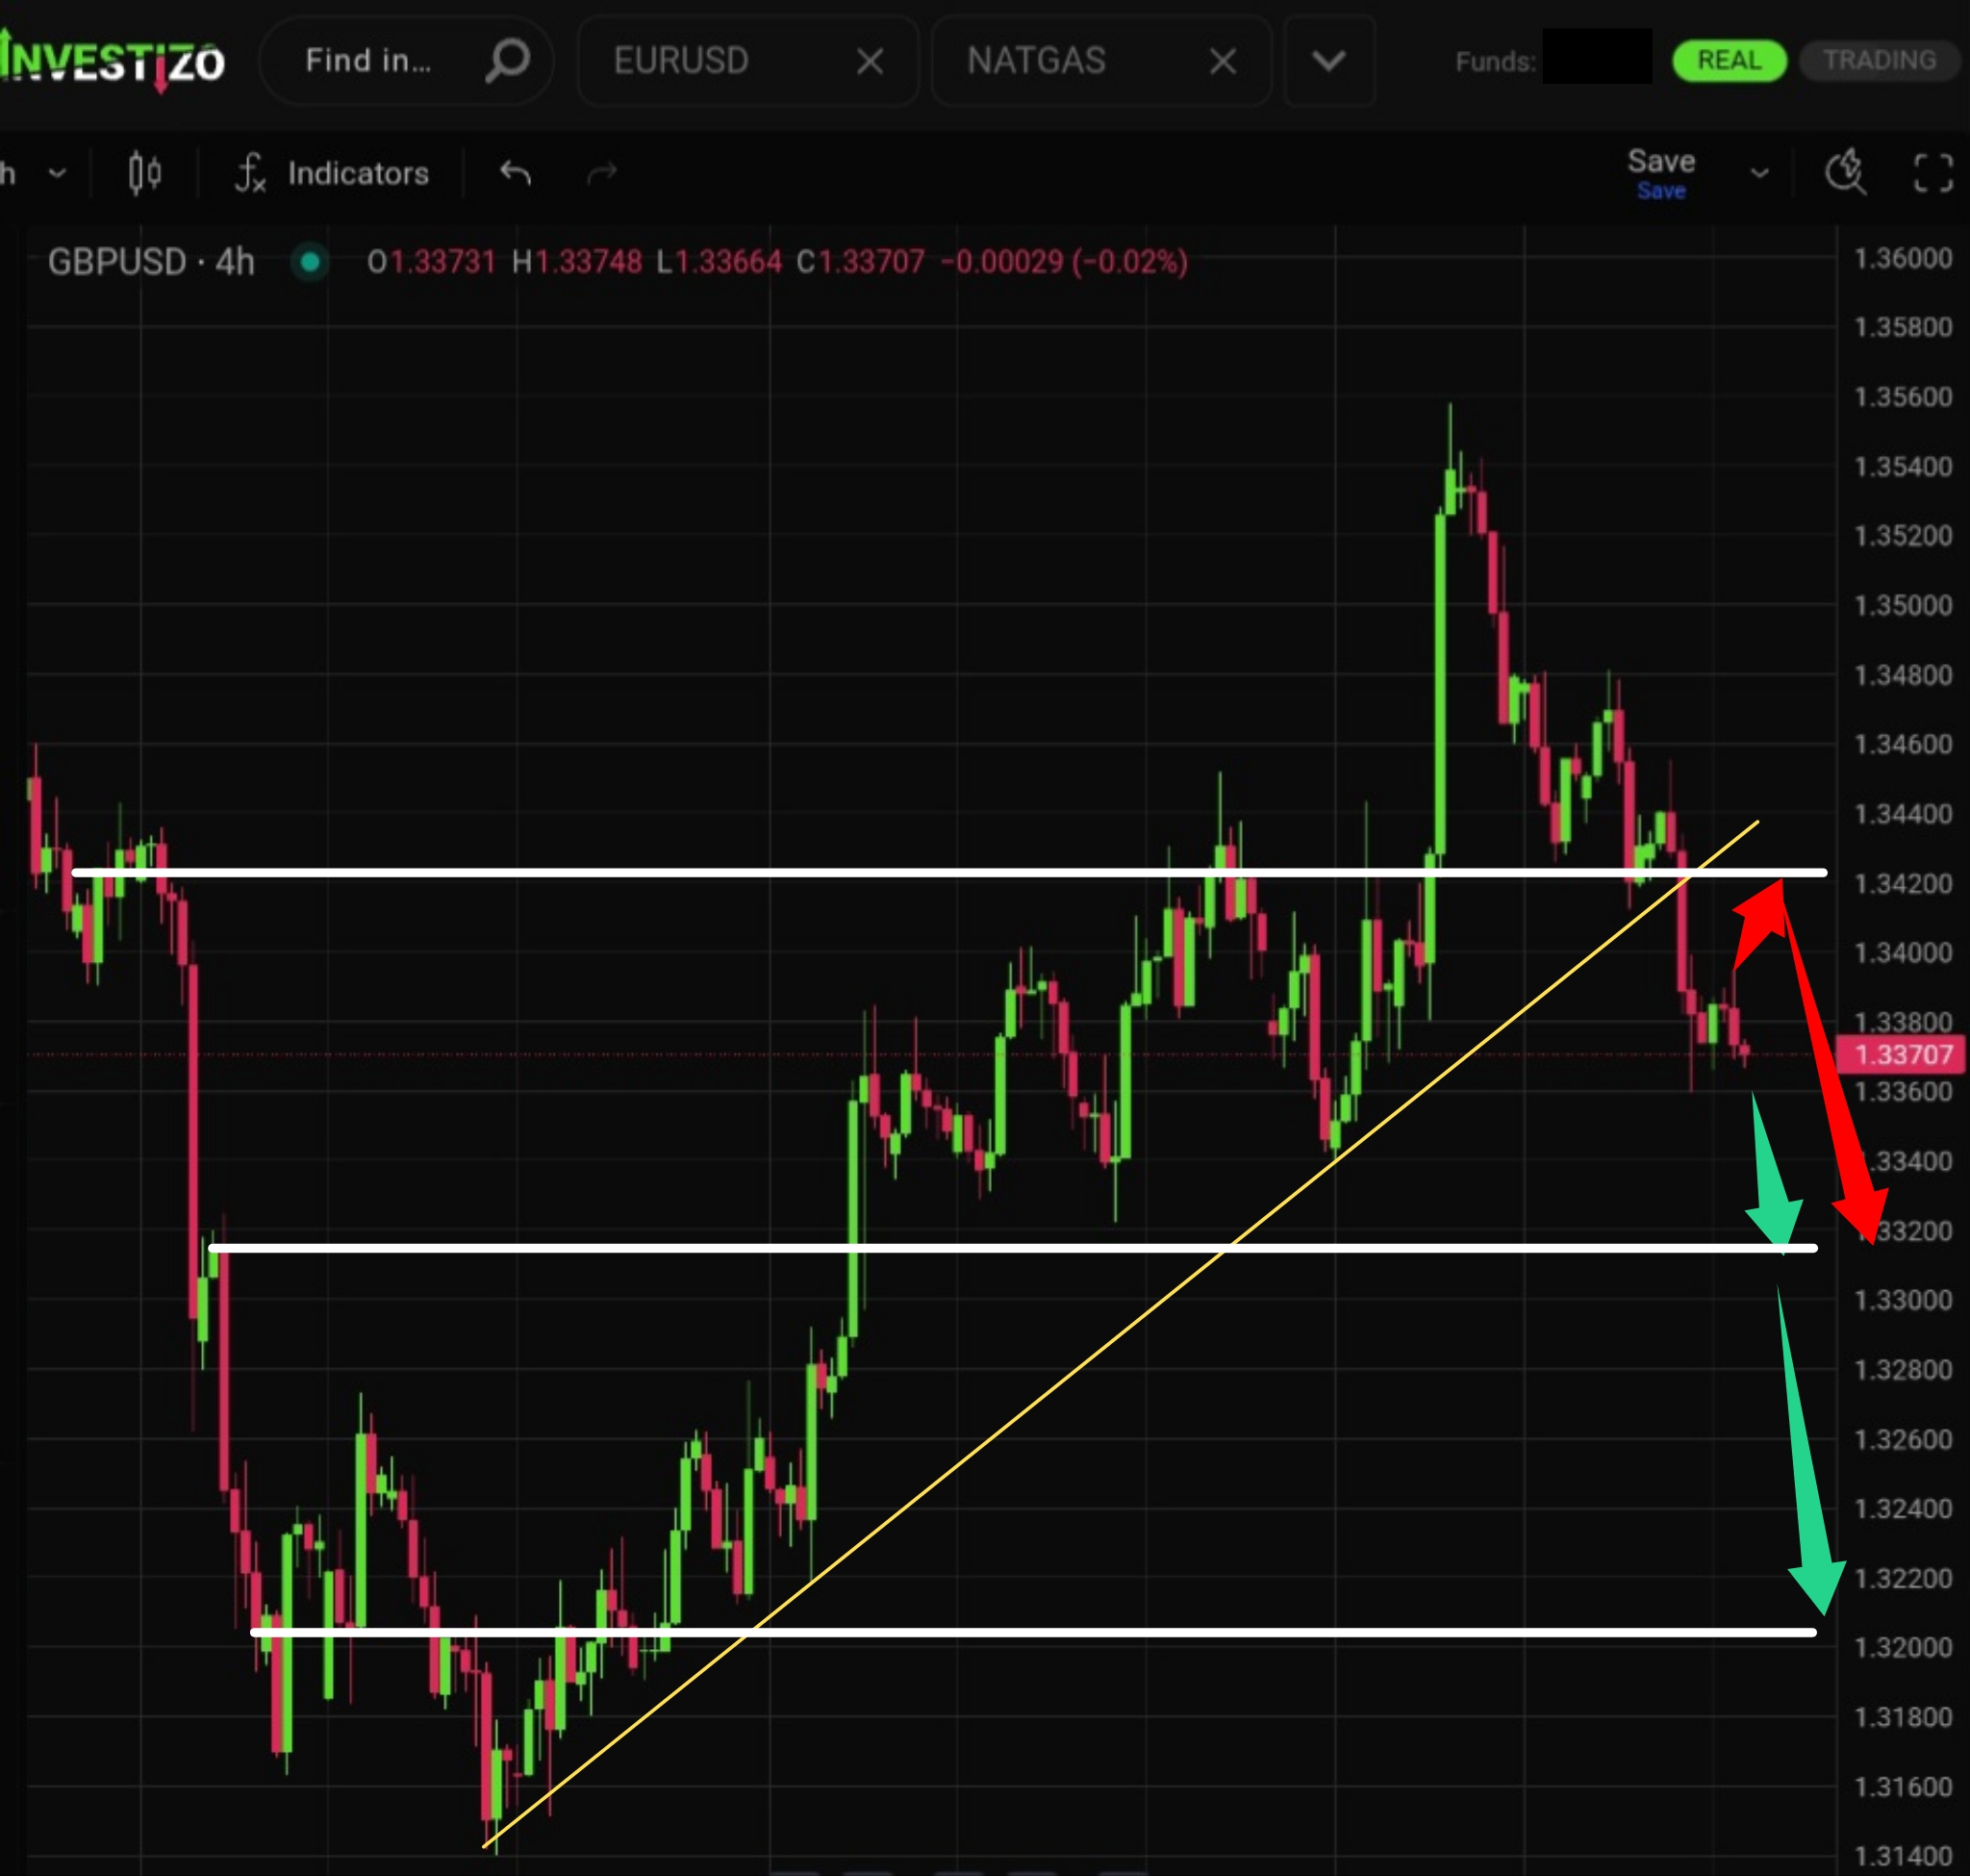
The market is debating whether the breakout above the ascending channel signals a full shift toward buyer dominance or if it was merely a false breakout.
The local uptrend that followed the breakout of the trendline appears to have completed.
The strong upward momentum triggered active profit-taking, resulting in a sharp local sell-off of nearly 70 pips.